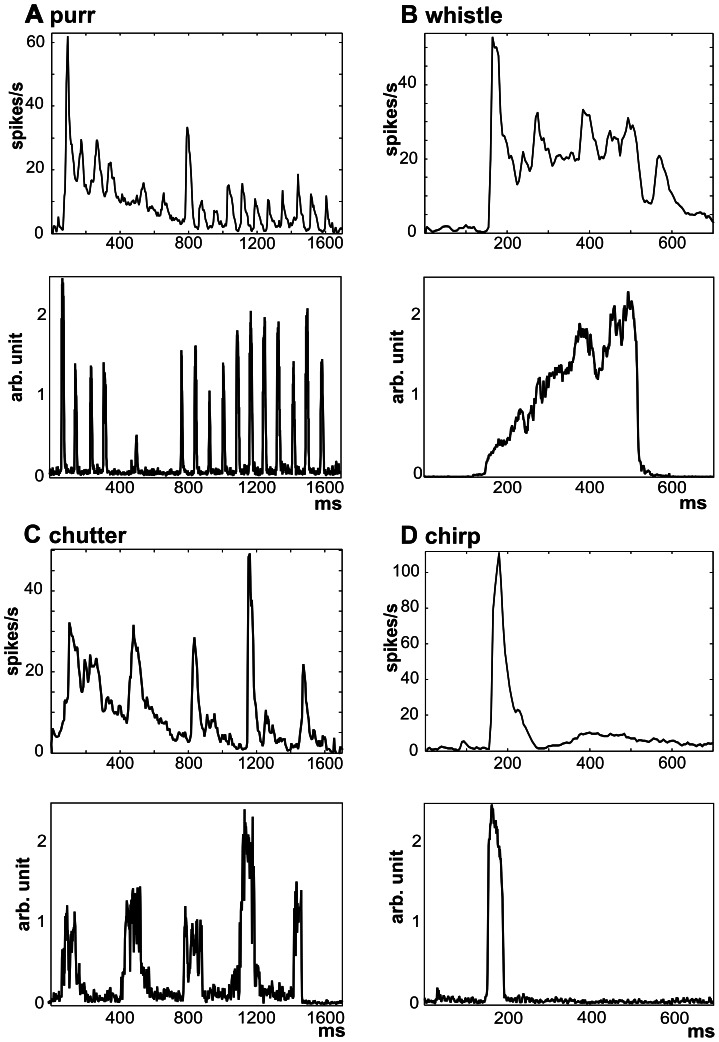
Figure 2. Comparison of the temporal envelope of the calls and the neuronal response.
A comparison of the population PSTHs (n = 502, top) and the sound envelopes (bottom) is shown for all four calls: purr (A), whistle (B), chutter (C) and chirp (D). Each population PSTH is calculated as the average PSTH of all recorded units.

