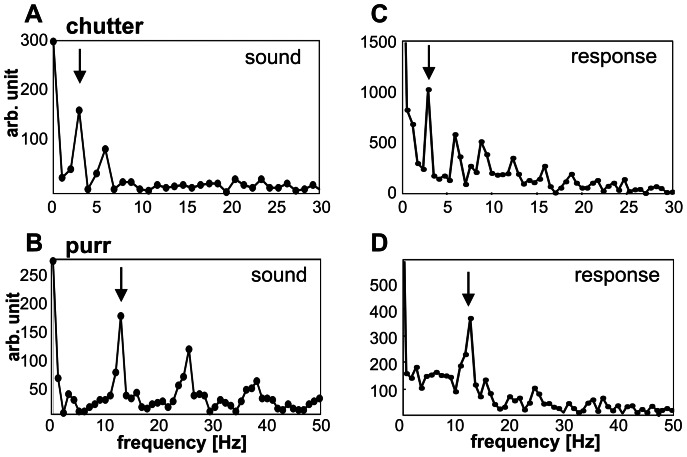
Figure 3. Coding of the vocalization frequency for chutter (A, C) and purr (B, D).
The local maximum in the spectrum of the sound envelope (marked by an arrow in A and B) that corresponds to the average repetition rate of phrases can be detected in the frequency spectrum of the population PSTH (marked by an arrow in C and D) for chutter (C) and purr (D).

