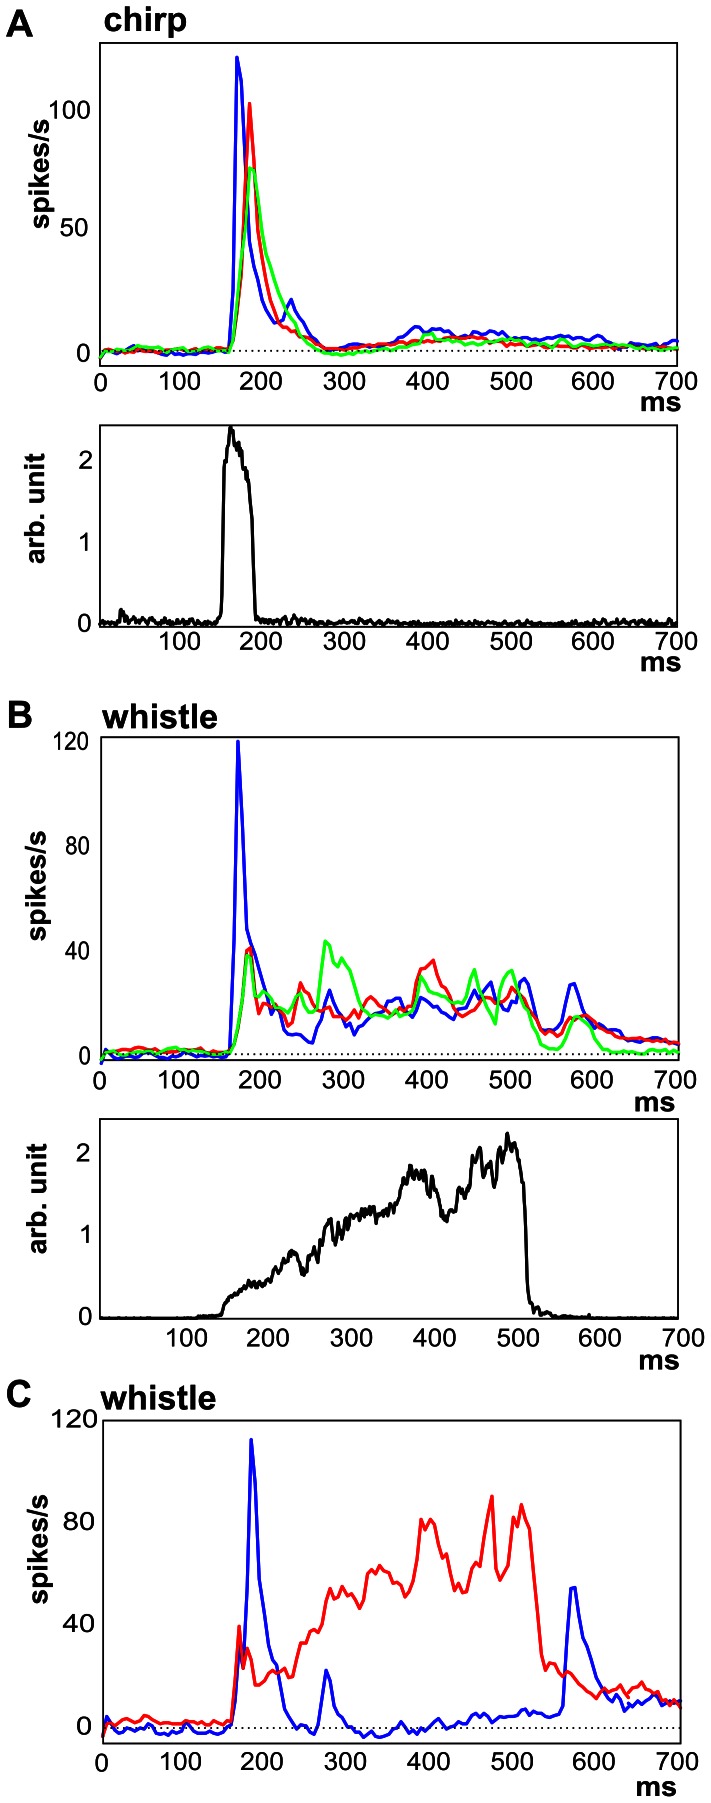
Figure 6. Differences in neuronal response patterns.
The subpopulation PSTHs calculated for all low-CF neurons (CF <7 kHz, blue), middle-CF (7–14 kHz, green) and high-CF (>14 kHz, red) subpopulation PSTHs are compared for chirp (A) and whistle (B). The lower panels of (A) and (B) shows the call envelopes. Plot (C) shows a comparison of the subpopulation PSTHs calculated from individual PSTH with negative correlation to sound envelope (blue) and subpopulation PSTHs calculated from individual PSTH with high correlation to sound envelope (r>0.5, red) for whistle.

