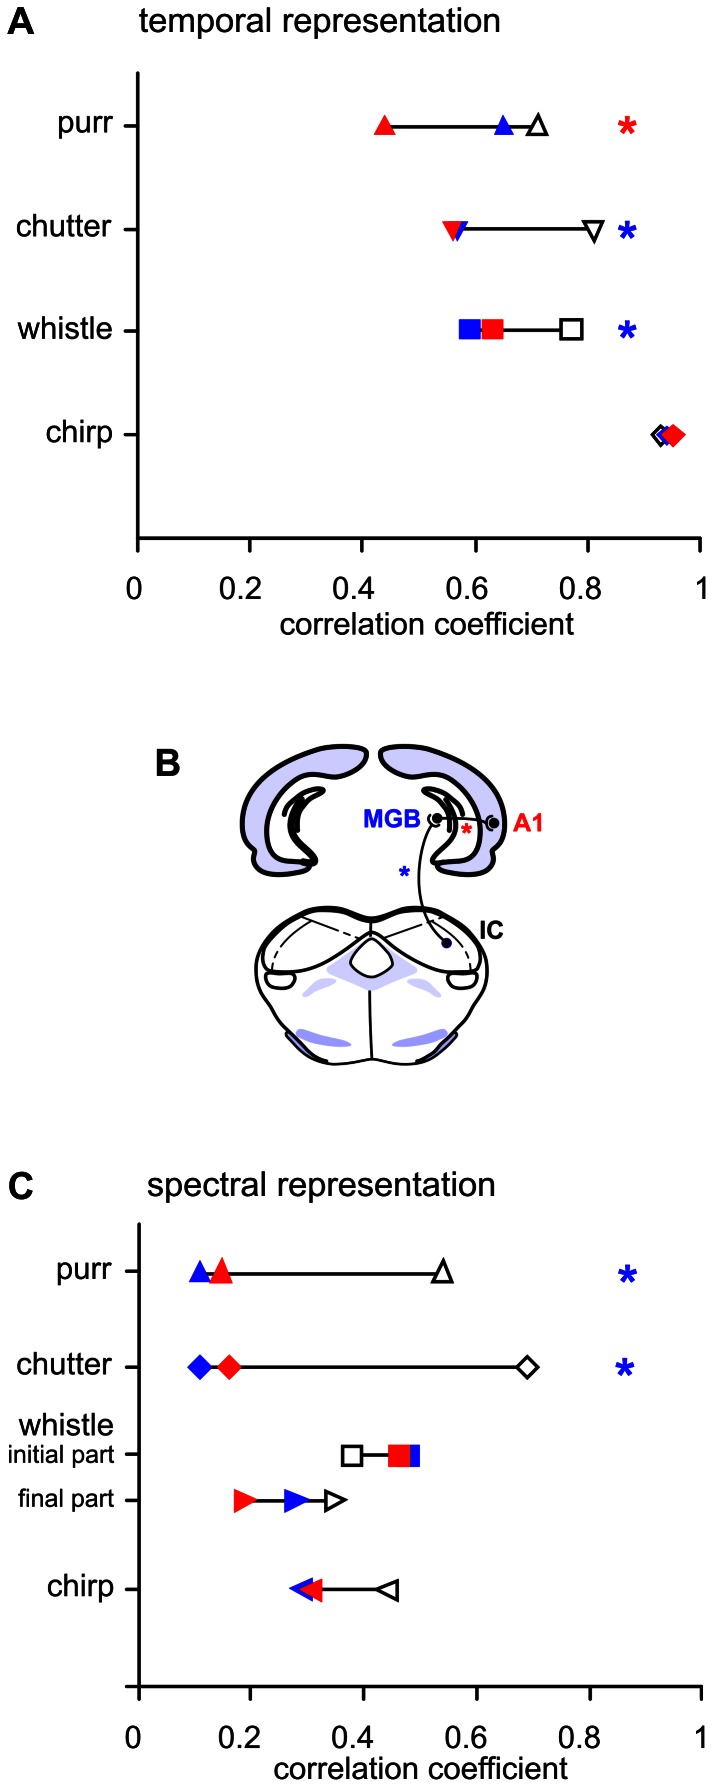
Figure 7. Comparison of subcortical nuclei (IC, MGB) and the auditory cortex.
The correlation coefficients between the sound envelope and the averaged PSTH (A) and the correlation coefficients between the sound frequency spectrum and rate vs. CF profile (C) are compared in the inferior colliculus (IC, open), medial geniculate body (MGB, blue) and auditory cortex (AI, red) for individual call. Panel (B) shows a schematic drawing of a part of the ascending auditory pathway. IC data based on 153 neurons are taken from [2]; MGB data calculated from 209 neurons are taken from [18]. The bootstrap method was used to determine whether the values of the correlation coefficients in individual nuclei were statistically different (P<0.01). The blue stars indicate cases of tecto-thalamic transformation of the neuronal response in which the IC data were significantly different from the MGB and AI data, while the difference between the MGB and AI was not significant. The red star indicates a case of thalamo-cortical transformation of the neuronal response in which the AI data were significantly different from MGB and IC data, while the difference between the MGB and IC was not significant.

