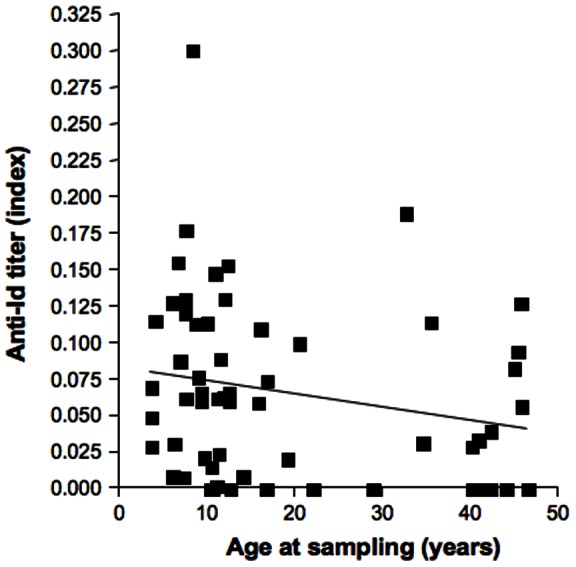
Figure 2. Anti-Id levels in progressors of the NHS cohort at baseline in relation to age at sampling.

Anti-Id levels were plotted against age at sampling. Linear regression line is shown.

Anti-Id levels were plotted against age at sampling. Linear regression line is shown.