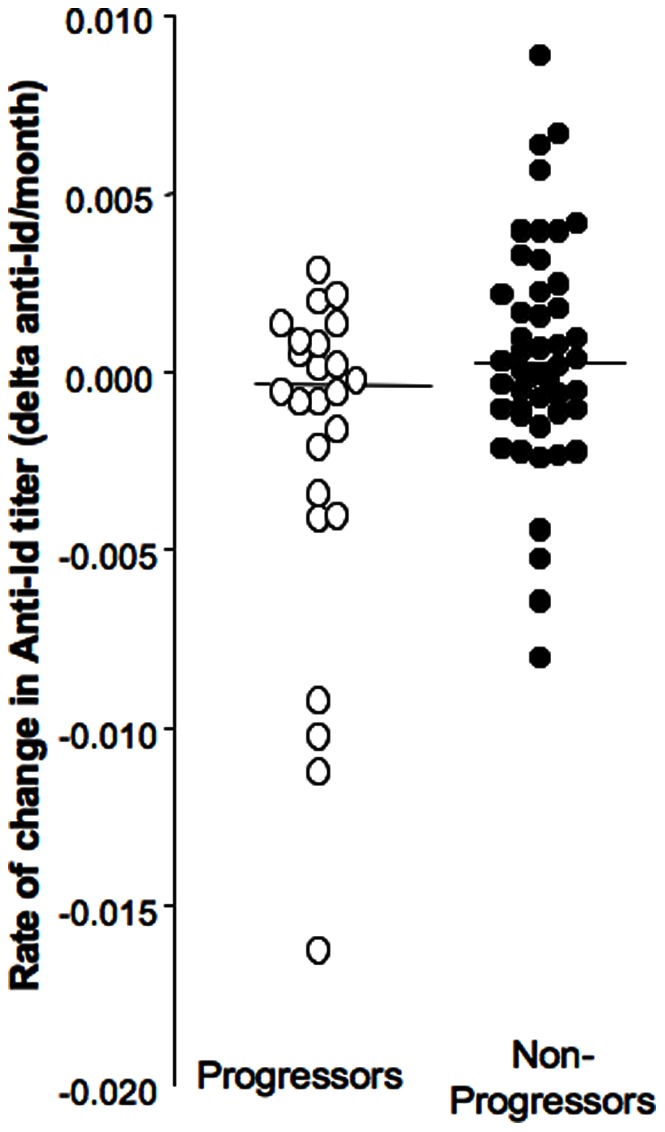
Figure 5. Longitudinal changes in anti-Id level during follow up in DiPiS progressors and matched non-progressors.

Longitudinal changes in anti-Id levels over time are presented as rate of change (as described above). Changes in anti-Id level and median are shown for progressors (white circles) and matched non-progressors (black circles).
