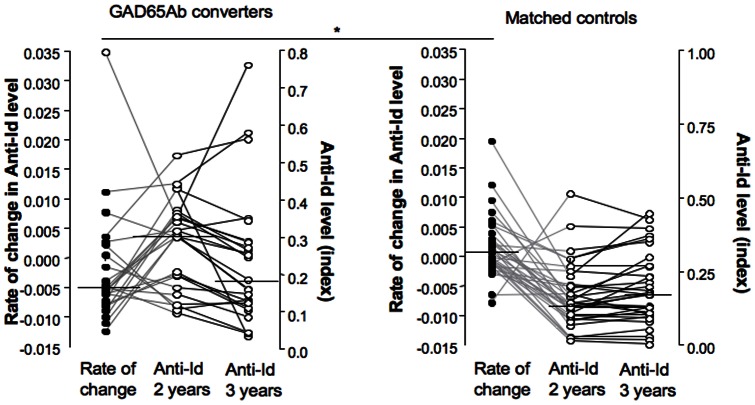
Figure 6. Longitudinal changes in anti-Id levels during the first measured interval (2–3 years of age) in GAD65Ab converters and matched controls.
Changes in anti-Id over time are presented as rate of change (as described above) and are shown as black circles. For comparison to individual samples, anti-Id levels at ages 2 and 3 are shown as white circles. Significant differences in the medians are indicated by the horizontal bar and asterix.

