
Figure 2. SCD1 expression in ALS patient muscle and after nerve injury.
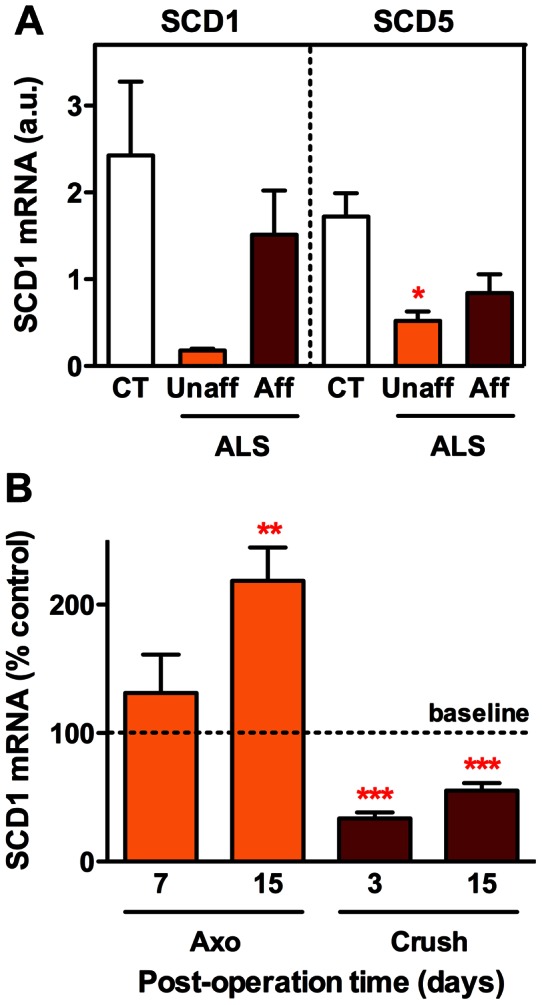
(A) Expression of SCD1 and SCD5 in deltoid muscle biopsies from ALS patients and healthy subjects (CT, white columns), as identified by microarray analysis of the database deposited at http://www.ebi.ac.uk/arrayexpress/(accession number E-MEXP-3260) [12]. ALS samples were obtained from muscle not clinically or electromyography affected (Unaff, orange columns) and from muscle with advanced pathology, characterized by reduced strength and neurogenic electromyography pattern (Aff, brown columns). *P<0.05 (1-way ANOVA followed by Tukey's multiple comparison test, n = 4–10). (B) Expression of SCD1 in gastrocnemius following sciatic nerve axotomy (Axo) or crush at indicated post-operation days. Contralateral muscle expression is represented by 100% baseline. **P<0.01, ***P<0.001 (One sample t-test, n = 4–10).