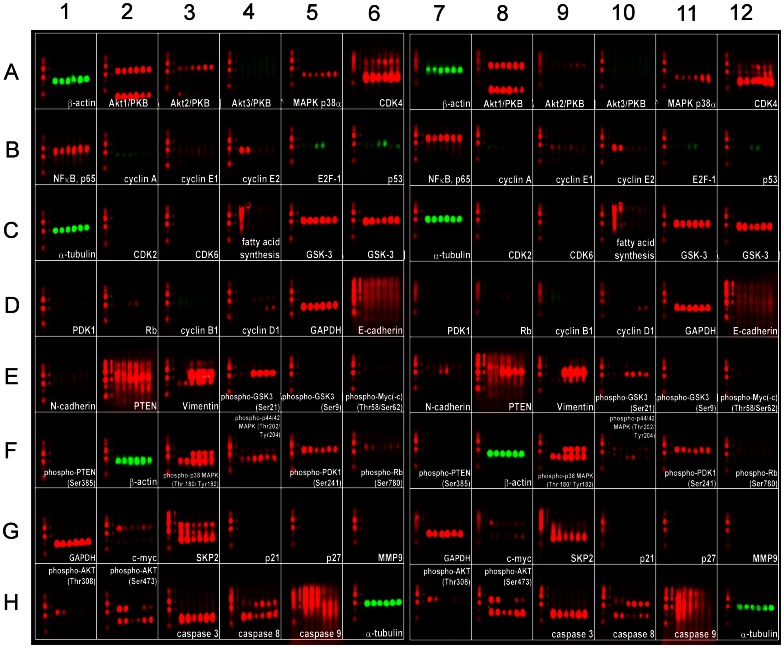
Figure 6. Micro-Western Array analysis of protein expression in CDXR-3, DU-145, and PC-3 cells treated with 0 or 20 µM triol.
CDXR-3, DU-145, and PC-3 cells were treated with 0 or 20 µM of triol for 48 hrs. Cell lysates were collected according to Micro-Western Array (MWA) protocol [18] and MWAs were performed to measure the changes in abundance and modification of indicated proteins. The six samples printed in each well from left to right were CDXR-3 (control), CDXR-3 (20 µM triol), DU-145 (control), DU-145 (20 µM triol), PC-3 (control), PC-3 (20 µM triol) (Figure S2). The right half blot (well A7-H12) was the technical duplicate of the left half blot (well A1-H6). Antibody list is shown in Table S2. Red and green were artificial color for anti-rabbit and anti-mouse 2nd antibody, respectively. The blot is the same size as a standard 96-well microtiter plate. Relative protein abundance of each signaling protein in each cell line is listed in Table S3.

