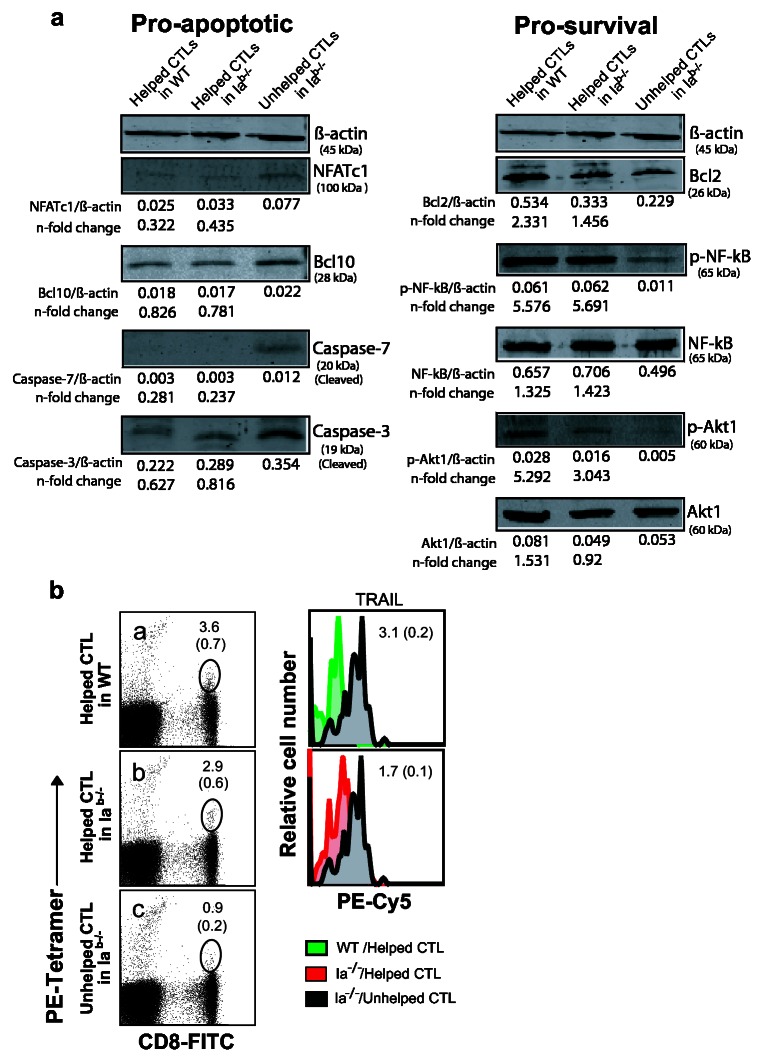
Figure 4. Immunoblot analysis of the expression and phosphorylation status of pro-survival and pro-apoptotic proteins.
(a) Lysates prepared from helped or unhelped CTLs obtained from WT or CD4+ T cell-deficient mice were subjected to SDS-PAGE, and transferred to the nitrocellulose membrane. Western blotting was performed with a panel of Abs specific for β-actin, Bcl-2, Bcl10, Akt1, NF-κB-p65, phosphorylated-Akt1 and -NF-kB-p65, cleaved Caspases-3 and -7, or NFATc1 transcription factor and analyzed by the ODYSSEY densitometer. Densitometric values were normalized on the β-actin control and n-fold changes of normalized targets in the helped CTLs of WT or Iab-/- mice relative to the unhelped CTLs in Iab-/- mice are shown below the corresponding lanes. Data are derived from samples pooled from four to six mice in each group of the first experiment. The results of the second experiment are consistent with the first experiment (data not shown). One representative of two independent experiments is shown. (b) Representative FACS plots of helped CTLs from WT or CD4-deficient mice, or unhelped CTLs from CD4-deficient mice. Blood samples from helped CTLs in WT and Iab-/- mice and unhelped CTL in Iab-/- mice were collected 16 days of adoptive transfer and processed for triple staining. Value in panel a, b and c represents percentage of tetramer+-and CD8+-specific double-positive cells in the total of CD8+ T cell population. The tetramer+-and CD8+-specific double-positive cell populations were gated (in the circle) for analysis of TRAIL expression. Histogram overlays (right panels) of CD8+ tetramer+-gated helped CTLs from WT (histogram green filled overlays; right top panel) or CD4-deficient mice (histogram red filled overlays; right bottom panel) and CD8+ tetramer+-gated unhelped CTLs from CD4-deficient mice (histogram grey filled overlays; right top and bottom panel). The mean of fluorescence intensity (MFI) was calculated from triplicate values. The value in each panel represents the mean of MFI ± SD of positive staining cells (grey) versus the controls with MFI of 0.5 for green and MFI of 0.8 for red, respectively. One representative of two independent experiments is shown.

