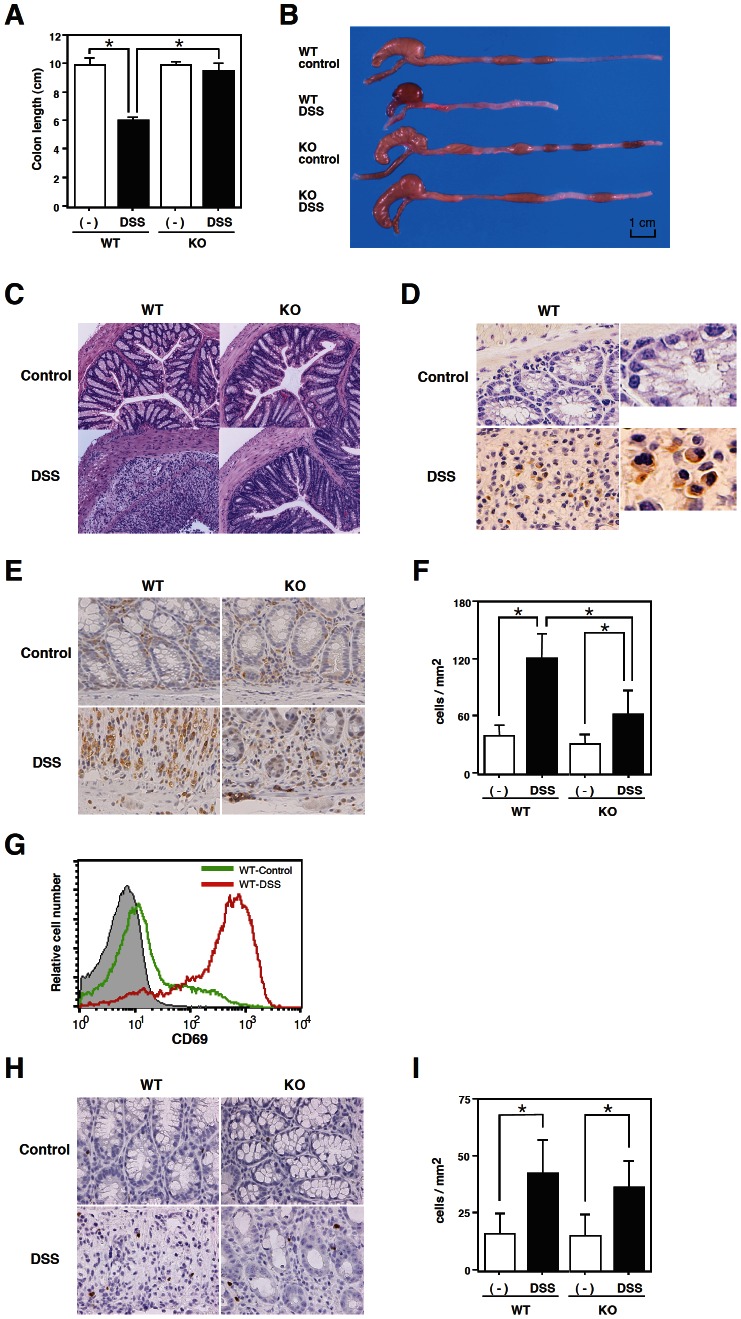
Figure 2. DSS-induced colocecal damage was reduced in CD69 KO mice.
(A) The colon length. On day 8, the colon length of DSS-exposed wild-type (WT) and CD69 KO mice and control mice was measured. The data are presented as the means (SEM) (n = 12 per group). *p<0.01. (B) A representative photograph showing the gross appearance of the colon from each group is shown. (C) Histological sections of inflamed colons. Colons were taken on day 8 from WT and CD69 KO mice that received DSS in drinking water. Sections were prepared and stained with hematoxylin and eosin (original magnification 40×). (D) Immunohistochemical staining of CD69-positive cells in the colonic tissues of DSS-treated WT mice (original magnification 300× and 600×). (E, H) Immunohistochemical staining of CD3-positive cells (E) and FoxP3-positive cells (H) in the colonic tissues of DSS-treated WT and CD69 KO mice (original magnification 200×). (F, I) Summary of the accumulation of CD3-positive cells (F) and FoxP3-positive cells (I). Data are from 20 fields from 5 mice. *p<0.01. (G) The expression of CD69 on electronically gated lamina propria CD4 T cells from control (green line) and DSS-treated (red line) WT mice. Background staining is shown as hatched areas.

