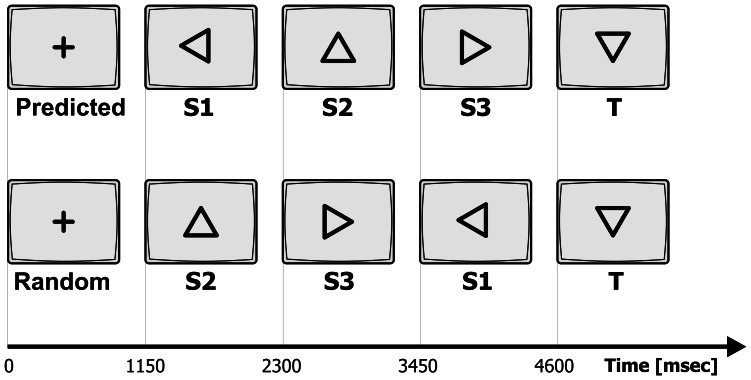
Figure 1. Task timeline.
Stimuli presented in the sessions. Sequences of standards S1, S2 and S3 with a predicted sequence (top) and in randomized order (bottom) preceding the target (T). The predictive sequence is always S1 followed by S2 and then S3 (n-1). Inter-trial intervals, including duration of stimulus presentation (150 ms) are displayed. Each block consisted of 6 different randomized sequences of standards (3–8 standards long) preceding the target; and 6 sequences of standards (3–8 standards long) with the predictive sequence preceding the target in each.

