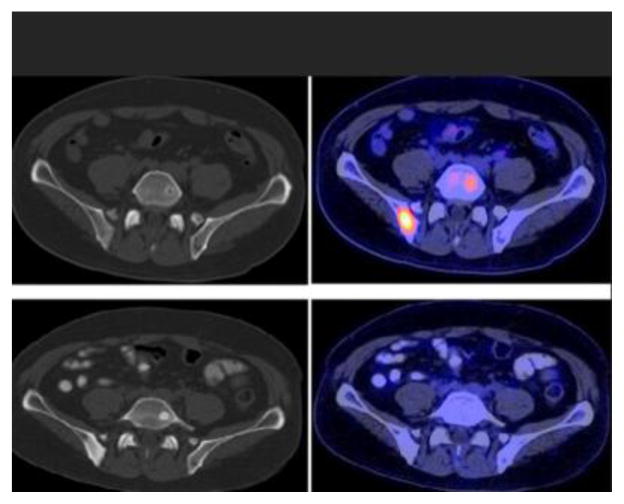
Fig. 2.
Treatment response evaluation with FDG PET/CT. CT at bone window level (left) and fused PET/CT (right) images demonstrate hypermetabolic lesions with little or no structural abnormality involving the right posterior ilium (SUVmax 5.5) and left L5 (SUVmax 3.6) before therapy (top panel, serum PSA=67.4 ng/mL) that become metabolically inactive (SUVmax 1.3) and sclerotic after successful chemotherapy (bottom panel, serum PSA = 0.3 ng/mL).

