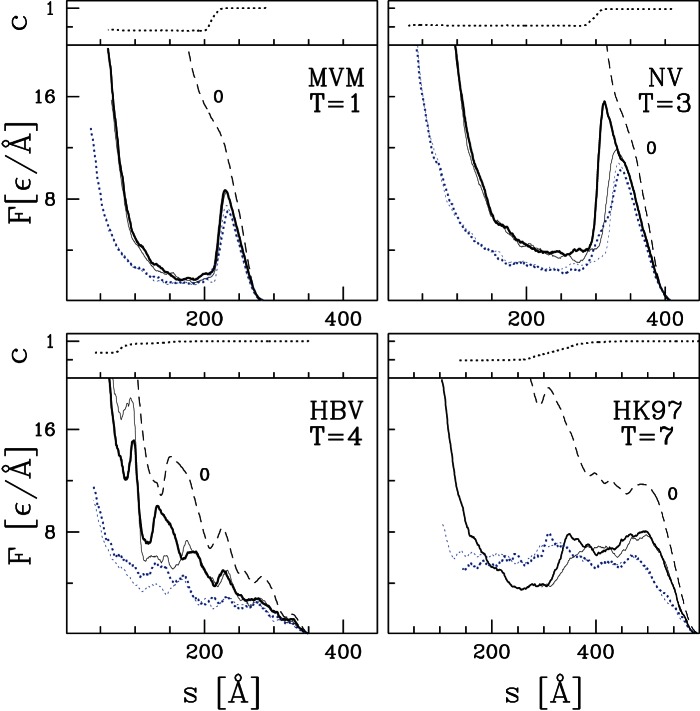
Figure 2. Nanoindentation processes in models for four experimentally studied capsids MVM, NV, HBV, and HK97.
As in Figure 1, each panel consists of two subpanels. The lower subpanel shows several  curves and the upper subpanel shows
  for the highlighted trajectory. For each capsid, two trajectories are shown for flat plates (solid lines) and for a tip with
  nm (dotted lines) at
  and one trajectory is shown for flat plates at zero temperature (dashed line).

