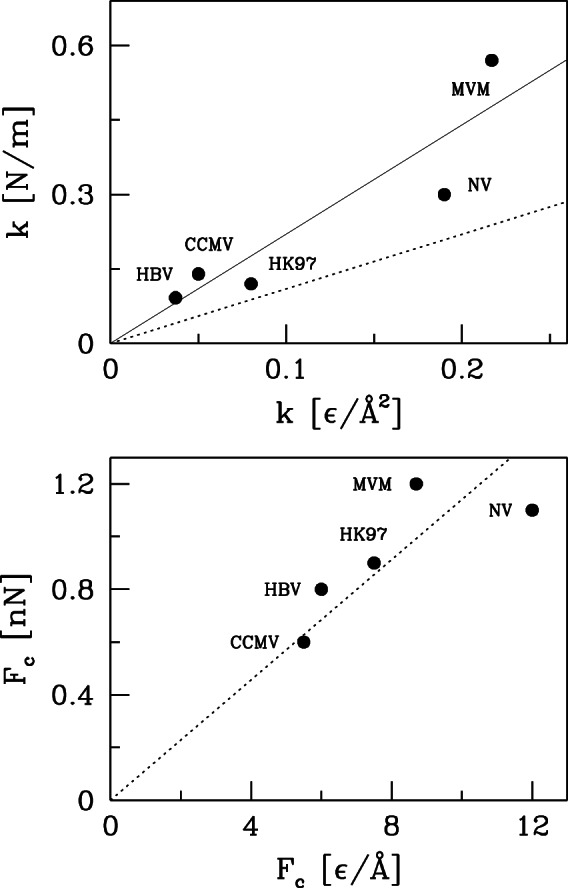
Figure 3. Comparison of experimental and theoretical results for  (the top panel) and
  (the bottom panel) for the five indicated capsids.

The dotted line is obtained using the value  Å
Å pN obtained by fitting mechanical stretching of proteins [22]. Results for
  are better fit if this quantity is doubled (solid line).
