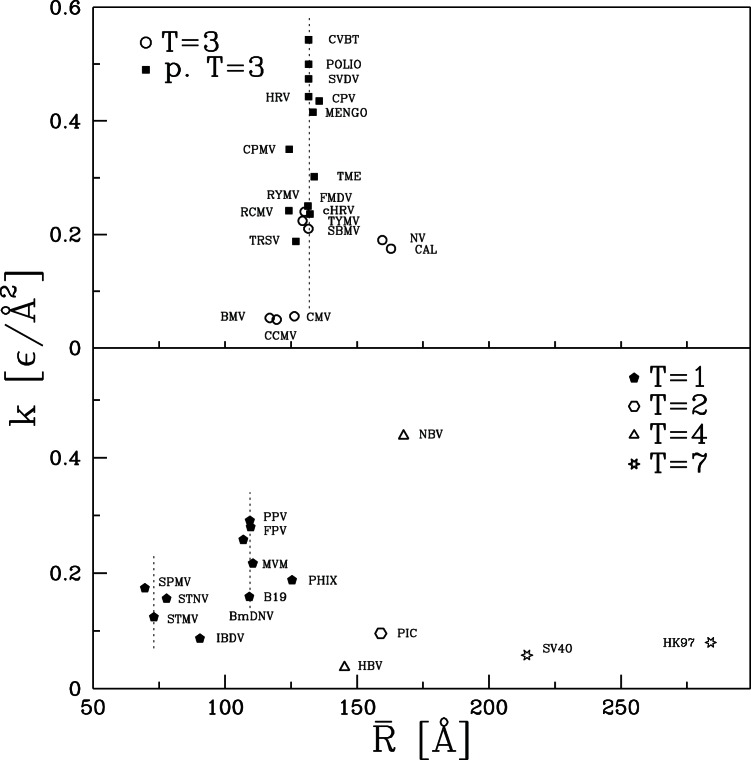
Figure 10. Simulation values for the effective spring constant plotted against the average radius of the corresponding capsid.
The top panel is for capsids of symmetry T = 3 and pseudo T = 3 and the bottom panel for the remaining capsids. The vertical dotted line in the top panel indicates  of 132 Å. In the bottom panel, the two similar lines correspond to
  of 73.0 and 109.4 Å.

