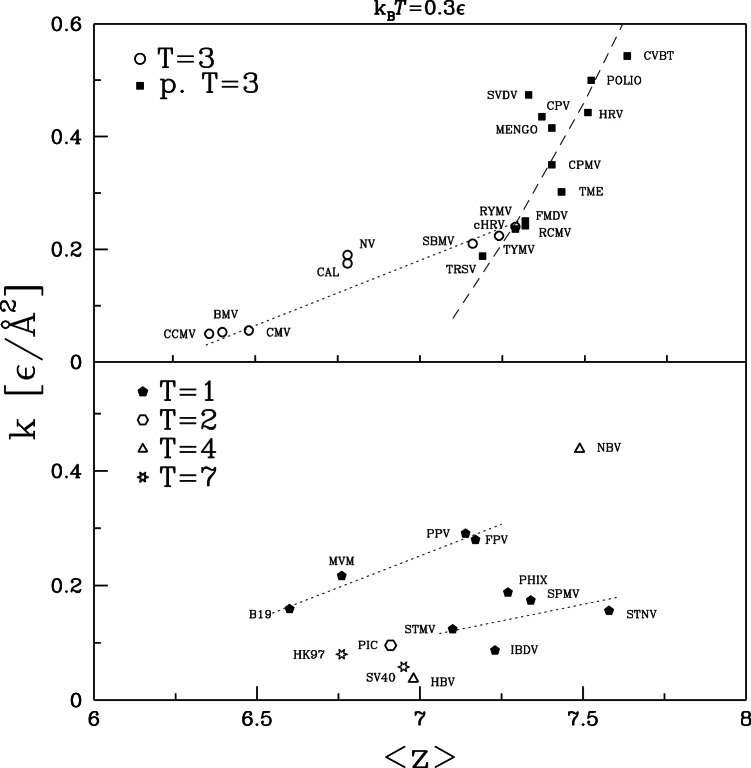
Figure 12. Effective spring constant plotted against the average coordination number of the corresponding capsid.
The top panel is for capsids of symmetry T = 3 and pseudo T = 3 and the bottom panel for the remaining capsids. Lines in the top panel show trends for T = 3 (dotted line) and pseudo T = 3 (dashed line). In the lower panel, the two lines link capsids with  close to 73.0 and 109.4 Å respectively.

