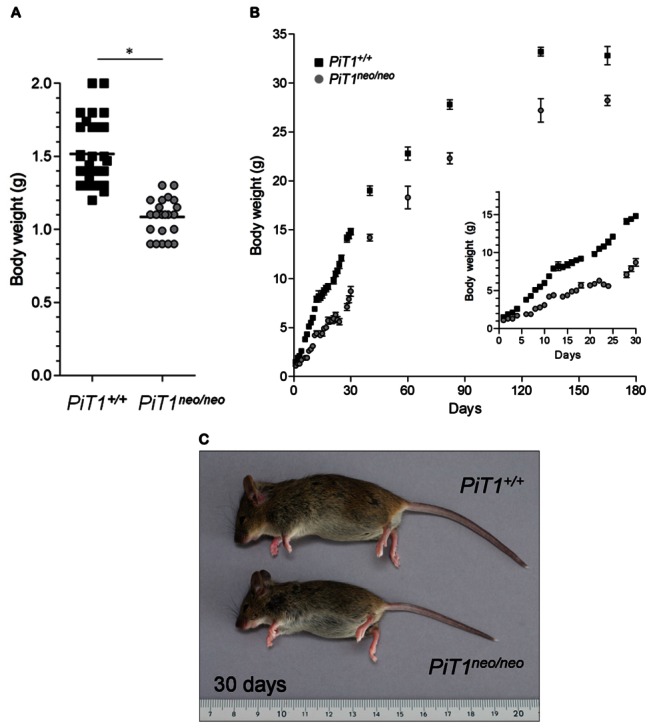
Figure 1. Growth of hypomorphic PiT1 neo/neo mice.

(A) Body weight (g) of 1-day-old PiT1 +/+ and PiT1 neo/neo mice. (B) Evolution of body weight of PiT1 +/+ (n = 3 to 19) and PiT1 neo/neo (n = 3 to 10) female mice from 1 to 165 days. Inset: growth curve of mice from 1 to 30 days of age. Data represent mean ± SEM. Statistical analysis was carried out by Mann & Whitney’s method. (C) Growth appearance of PiT1 +/+ and PiT1 neo/neo mice at 30 days of age.
