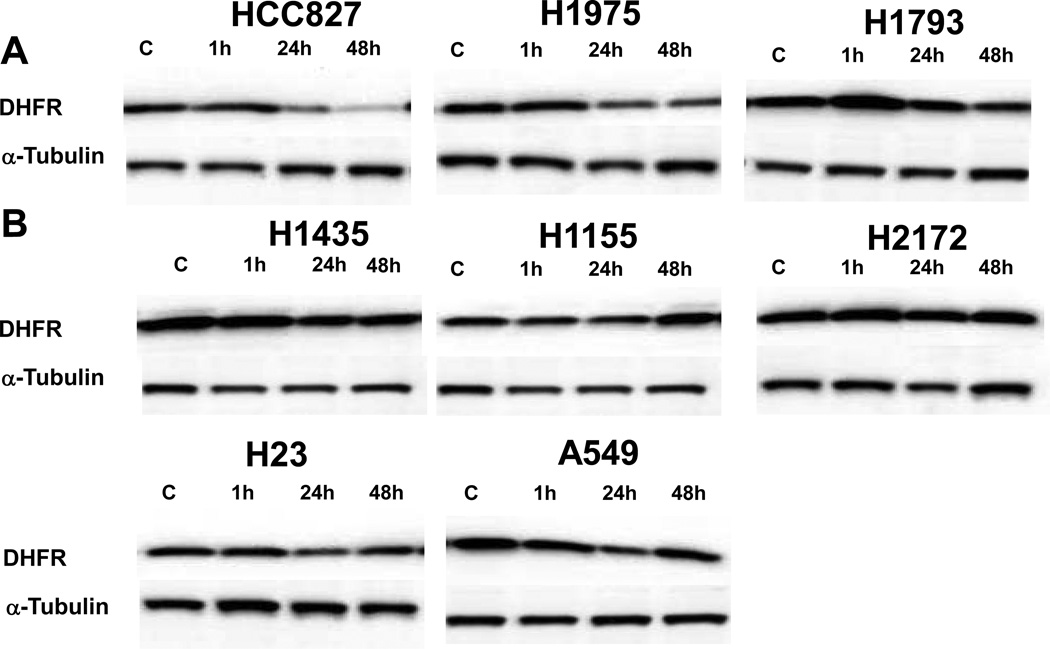
Figure 5. Immunoblot evaluation of dihydrofolate reductase (DHFR) in response to NVP-AUY922 exposure.
Immunoblot evaluation for DHFR as compared to α-tubulin after exposure to 50 nM of NVP-AUY922 for 1, 24 and 48 hours as compared to controls (C). The eight cell lines evaluated by microarray experiments are shown, including three cell lines with DHFR levels less than 40% of baseline when compared to a tubulin control at 48 hours (A) and five cell lines with less or no decrease in DHFR expression after exposure (B).

