
Figure 4. Dosage-course and time-course effect of IFN-γ on PD-L1 in SW480.
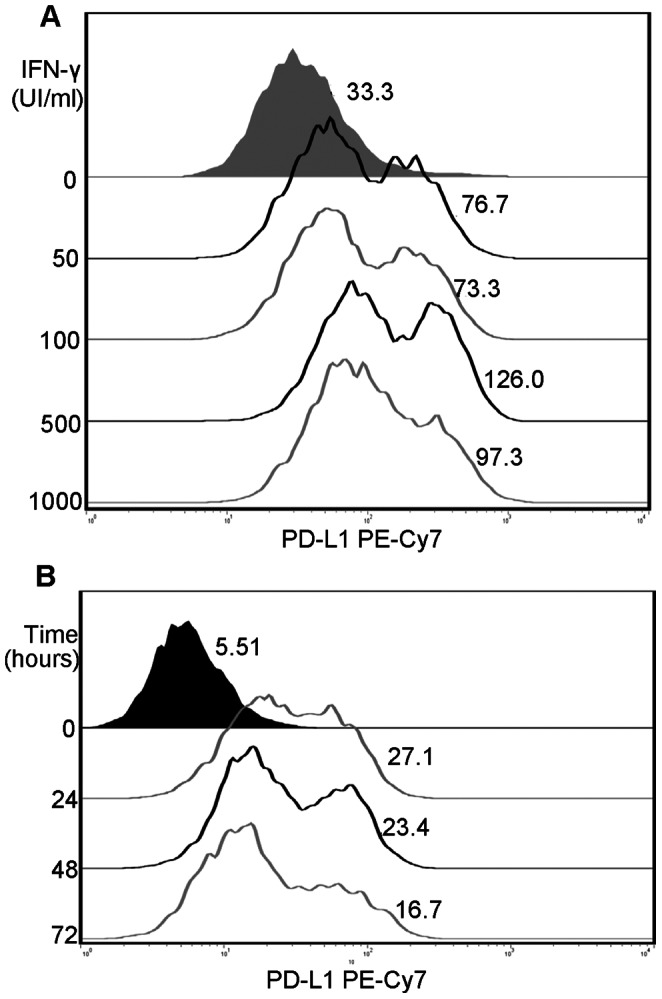
(A) SW480 treated with IFN-γ at indicated concentration (0 IU/ml, 50 IU/ml, 100 IU/ml, 500 IU/ml, 1000 IU/ml). (B) SW480 treated with 500 IU/ml IFN-γ for indicted times (0 h, 24 h, 48 h, and 72 h). Shaded area represents SW480 without treatment of IFN-γ, and numbers next to peaks represent standard fluorescence intensity of PD-L1. Representative images are selected from performed experiments repeated in triplicates.