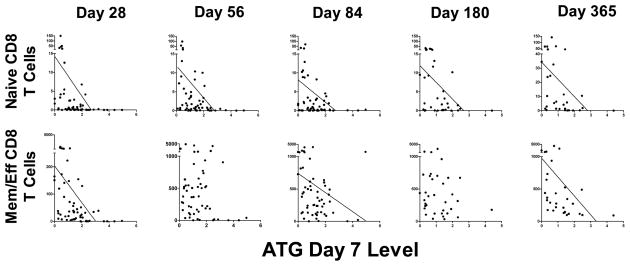
Figure 5. Effect of day 7 ATG serum levels on day 28, 56, 84, 180 and 365 counts of naïve (top) and memory/effector (bottom) CD8 T cells.
Trend line is shown in cases of p<0.05 as determined by Spearman rank correlation, demonstrating that higher day 7 ATG levels were associated with lower cell counts. On all x-axes, displayed are ATG levels on day 7 as mg/L serum. On all y-axes, displayed are cell counts per microliter blood.

