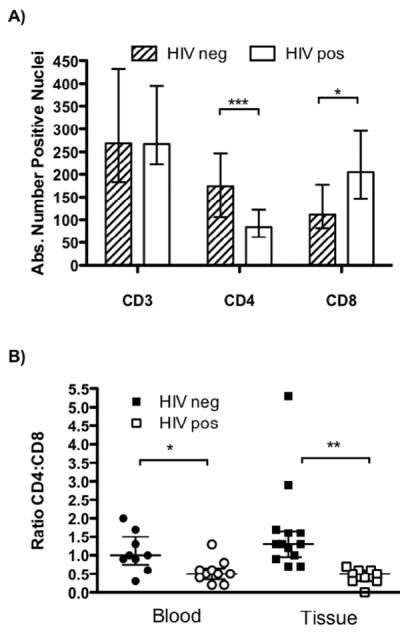
Figure 4. Quantification of the T cells in blood and tissue.

A) The absolute number of cells that positively stain for CD3, CD8 and CD4 expression in granulomatous tissue from one region of interest (×40 magnification) per HIV-negative and -positive patient. Results are the median and the error bars indicate the IQR. B) The ratio of CD4:CD8 T cells in the peripheral blood (circles) and in the infected tissue (squares) of the patient cohort. Closed symbols: HIV-negative samples and open symbols: HIV-positive samples. * p < 0.05, ** p < 0.01, *** p < 0.005 by two-tailed t-test.
