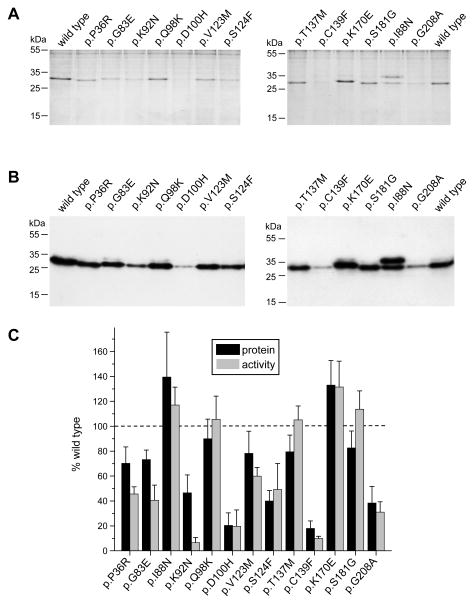
Figure 3.
Secretion of cationic trypsinogen variants from HEK 293T cells. Cells were transiently transfected and conditioned media were collected after 24 h. Trypsinogen protein levels were qualitatively analyzed on Coomassie Blue stained SDS-polyacrylamide gels (A) and then quantitatively determined by Western blots (B) and densitometry (C, black bars). Trypsin activity was measured after activation with enteropeptidase (C, gray bars). See Experimental Procedures for details. Representative gels and blots of four independent experiments are shown. Average of four experiments with SD was plotted. Trypsinogen protein and trypsin activity levels were expressed as percent of wild-type values.

