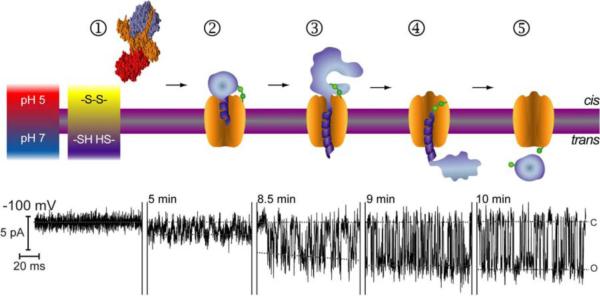
Figure 14.
Sequence of events showing BoNT light chain translocation through the heavy chain channel. Step1. BoNT/A holotoxin prior to insertion in the membrane (grey bar with magenta boundaries); BoNT/A is represented by the crystal structure rendered on YASARA using PDB accession code 3BTA351. Step 2. Schematic representation of the membrane inserted BoNT/A during an entry event. Steps 3 and 4. A series of transfer steps. Step 5. An exit event. Segments of typical single channel recordings are displayed under the corresponding interpretation for each step. Reprinted with permission from ref282. Copyright 2009. Elsevier.

