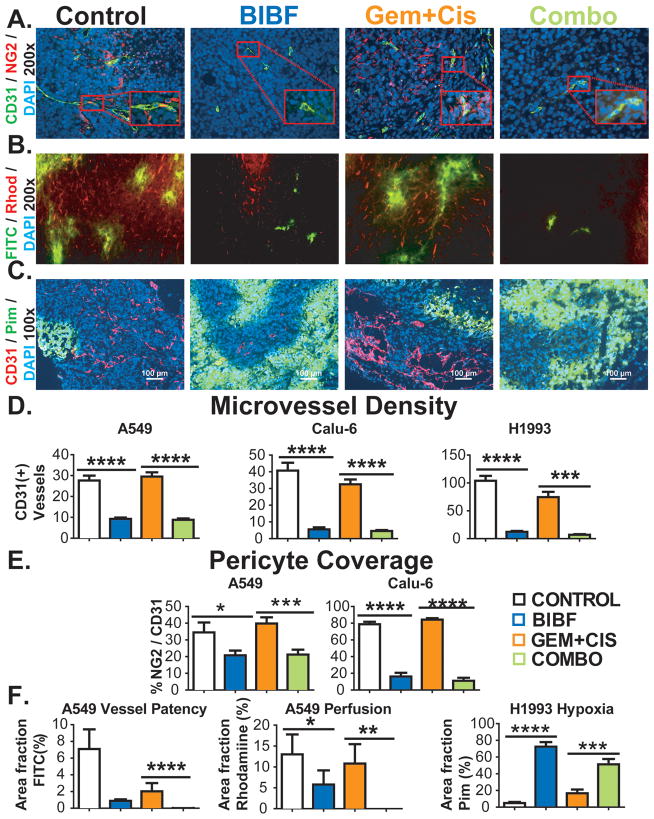
Figure 3. BIBF 1120 shows potent anti-angiogenic effects, decreases perfusion and induces hypoxia in lung cancer xenografts.
Vascular parameters of NSCLC tumors were evaluated by immunohistochemistry and perfusion studies. A) Representative images of microvessel density (CD31) and pericyte coverage (NG2) in Calu-6 xenografts at 200x magnification (inset: 400x), with DAPI labeling nuclei. B) Representative images of perfusion of high molecular weight (FITC, MW: 2 million) and low molecular weight (Rhodamine, MW 10000) dextrans in A549 xenografts. C) Representative images of hypoxia as assessed by pimonidazole staining in H1993 xenografts. Scale bar, 100 μm. Quantification of microvessel density (D), pericyte coverage (E) and dextran perfusion data and hypoxia (F). Vessel patency reflects signal from high molecular weight dextran and perfusion reflects signal from low molecular weight dextran. Bar graphs indicate means + SEM. A minimum of 5 images were acquired per group. Results were given as mean percentage of thresholded area or absolute vessel counts per 200x field. *, p<0.05; **, p<0.01; ***, p<0.001; ****, p<0.0001 by Dunn’s post-test.

