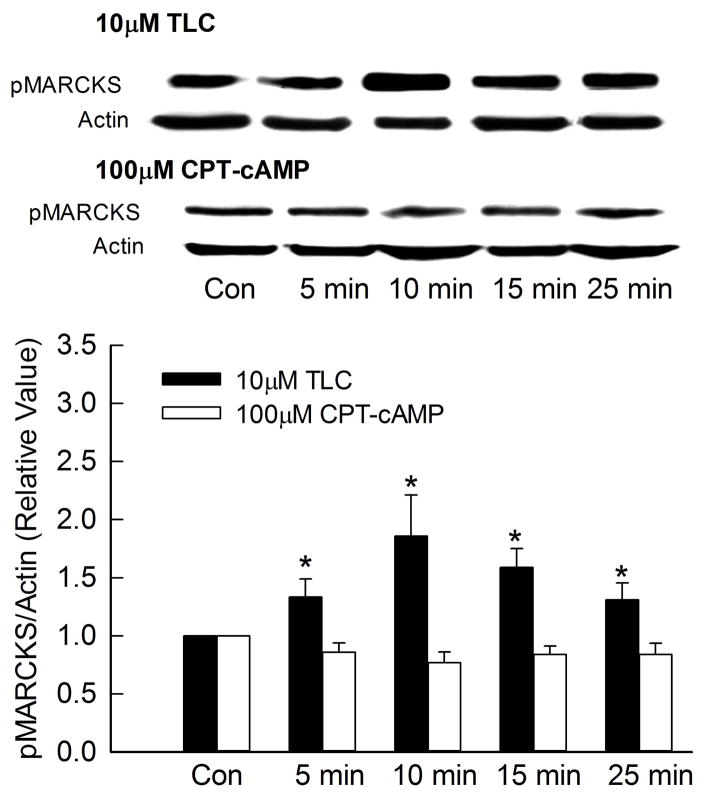
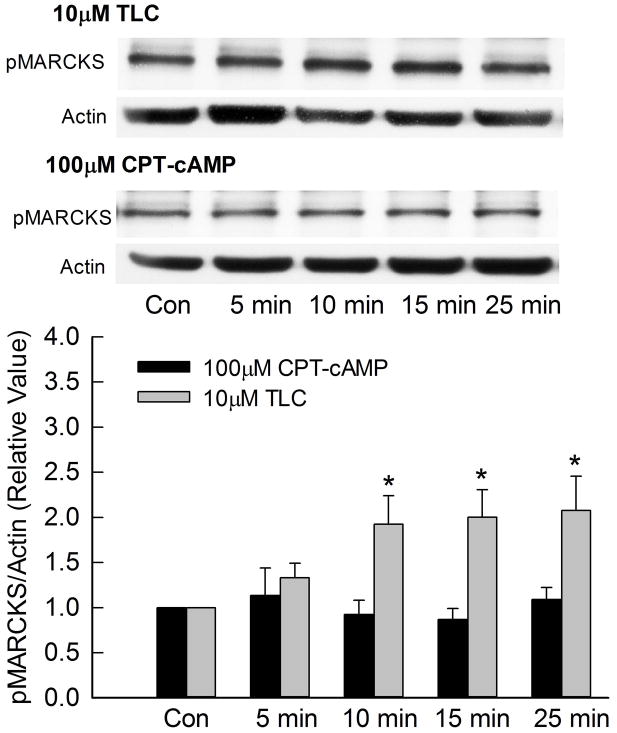
Figure 3.
TLC phosphorylates MARCKS. HuH-NTCP cells (A) or cultured rat hepatocytes (B) were treated with 10 μM TLC or 100 μM CPT-cAMP for the indicated time followed by determination of phosphorylated MARCKS (pMARCKS, 80kD) and actin (loading control). Typical immunoblots are shown in the upper panel and results of densitometric analysis (Mean±SEM, n=5) are shown in the bar graph. *Significantly different (p < 0.05) from control (Con) values.


