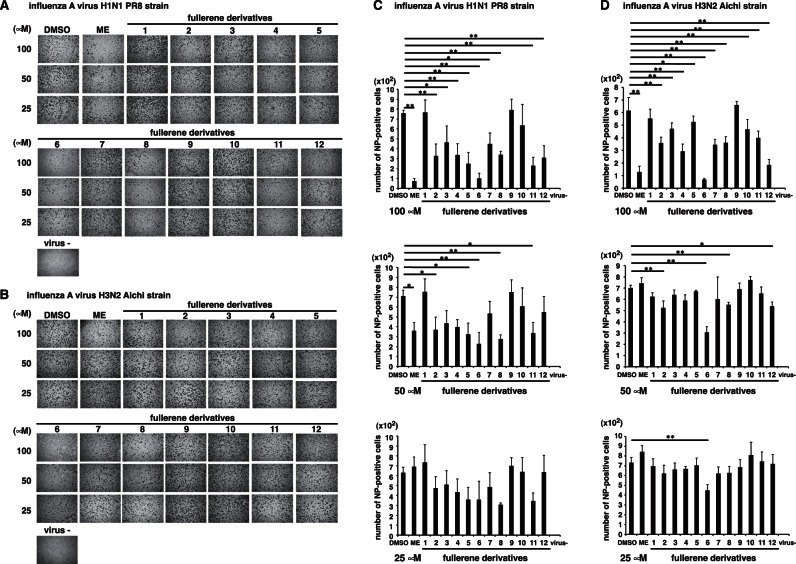
Figure 7. Immunostaining of influenza A virus-infected cells.
Various concentrations of the fullerene derivatives (25–100 µM) and an MOI of 1 influenza A virus (A/PR/8/34 (H1N1) (n = 3) (A and C) or A/Aichi (H3N2) (n = 4) (B and D)) were mixed and added to cultures of MDCK cells. At 24 h post-infection, influenza A NP-immunostaining of the treated cells was performed. The wells were photographed under a microscope (×4) (A and B), and the stained cells were counted (C and D). DMSO (n = 4) and ME (n = 4) were used as negative and positive controls for the inhibitory effect of influenza A virus infection, respectively. Data represent the mean ± S.E.M. *p<0.05, **p<0.01.

