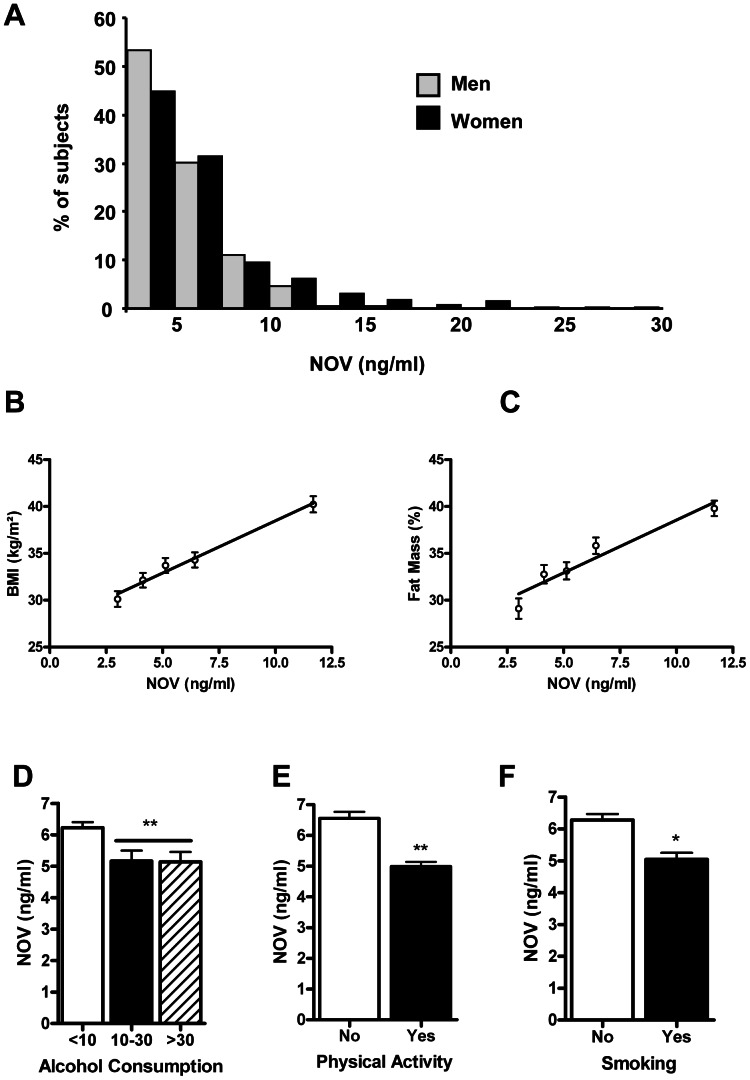
Figure 1. Sex, BMI, fat mass, alcohol consumption and physical exercise influence plasma NOV concentrations.
A/Plasma NOV (ng/ml) distribution among 242 men (light gray bars) compared to 352 women (black bars) shows a shift toward higher values in women. The number of subjects is presented as a percentage of total men or women in the study population. B and C/Represented here are the means of body mass index (BMI kg/m2) (B) and the fat mass (%) (C), according to quintiles of plasma NOV concentrations. D, E and F/NOV plasma variation as a function of modifiable risk factors.(D) Alcohol consumption defined as abstention or low alcohol intake (<10 g/day), moderate consumption (10–30 g/day) and elevated consumption (>30 g/day); (E) Physical activity; (F) Smoking. Values are the means ± standard deviation (*p = 0.005; and **p<0.0001).

