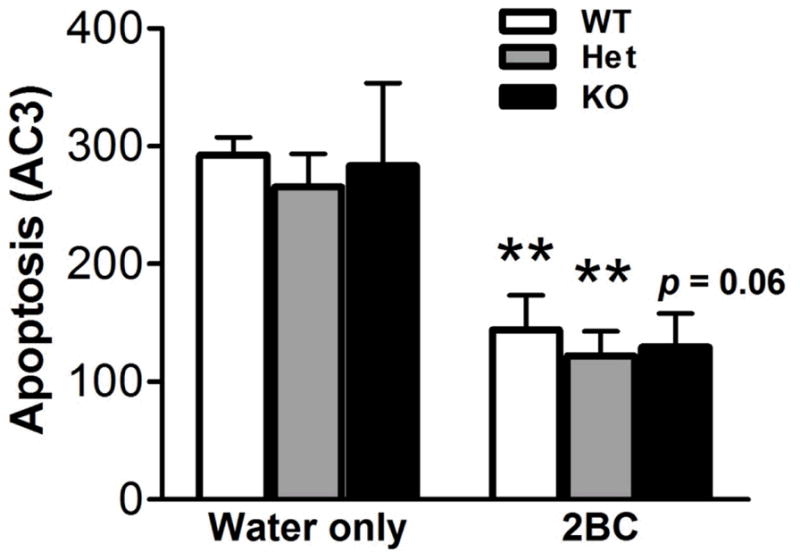
Figure 5.

Quantitative analysis of AC3-labeled apoptotic cells in the DG from the second group of mice (water only: WT, n = 4; Het, n = 4; KO, n = 4; 2BC: WT, n = 6; Het, n = 9; KO, n = 5). Post hoc analysis revealed significant differences between water-and ethanol-drinking mice of a given genotype (**, p < 0.01).
