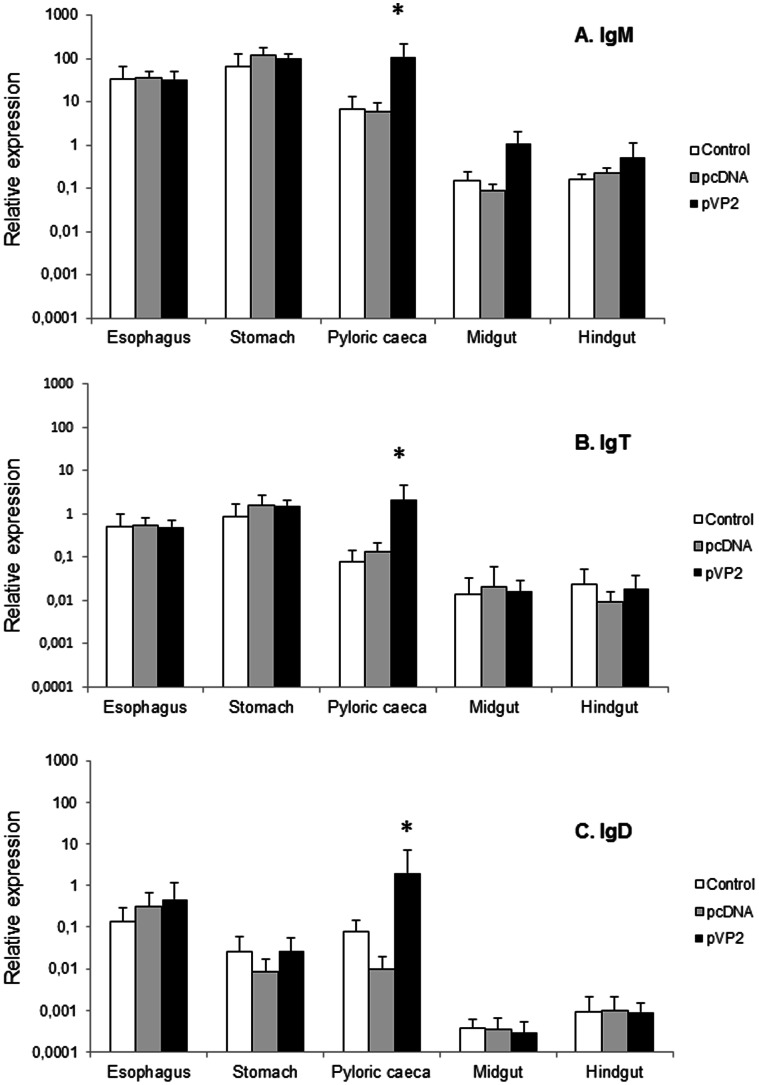
Figure 4. IgM, IgT and IgD modulation in response to oral DNA vaccination.
Trout were orally vaccinated with 10 µl of suspension of the vaccine microspheres each containing either 10 µg of pDNA-VP2 or 10 µg of the pDNA empty plasmid diluted in 10 µl of PBS. Finally, a third group received the same volume of an empty microsphere suspension. At day 10 post-vaccination, trout were sacrificed and the different segments of the digestive tract removed for RNA extraction and analysis of immune gene transcription through real time PCR. Levels of IgM (A), IgT (B) and IgD (C) transcription in the different segments were studied through real time PCR. Data are shown as the mean relative gene expression normalized to the transcription of the house-keeping gene EF−1α ± SD (n = 6). The relative significance of differences between fish vaccinated with either the empty plasmid or empty microspheres and vaccinated fish at each segment of the digestive tract was determined through a one-way ANOVA and is shown above the bars as *.

