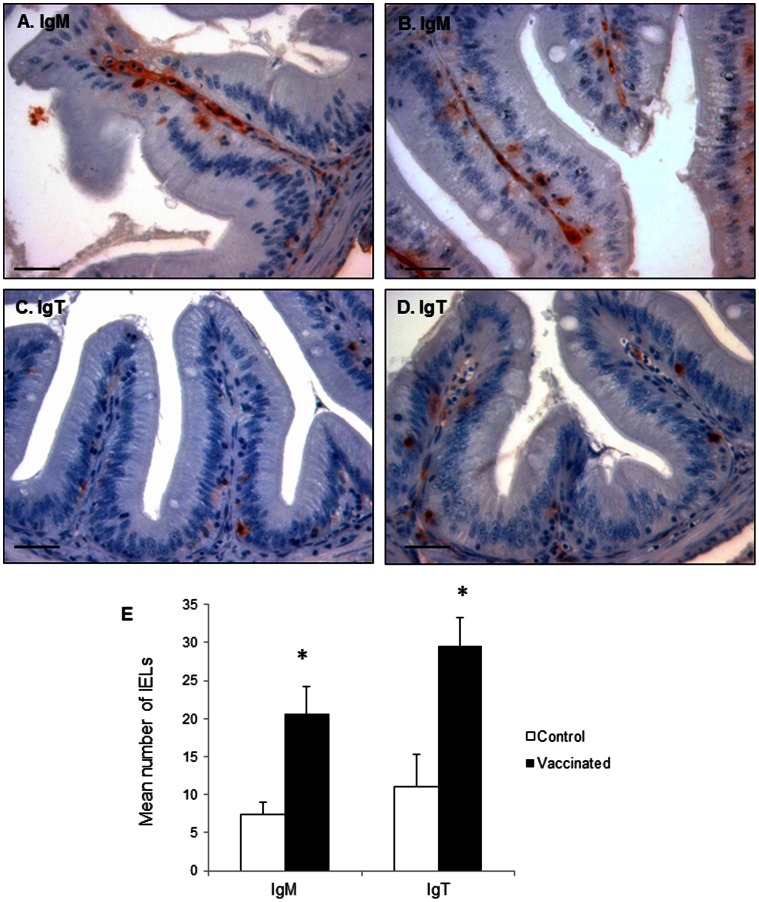
Figure 7. B cell detection in the pyloric caeca after oral DNA vaccination.
Immunohistochemical detection of trout IgM+ and IgT+ cells in pyloric caeca of mock-vaccinated (A, C) and vaccinated (B, D) fish. Trout were orally vaccinated as described in the legend of Figure 4 and sampled at day 10 post-vaccination. Bar: 200 µm. E. Mean number of IgM+ and IgT+ IELs counted in 35 fields of control and vaccinated fish (400× magnification). The quantification was performed in triplicate in 3 individual fish per group. *Number of cells in vaccinated fish significantly higher than the number of cells in the corresponding controls.

