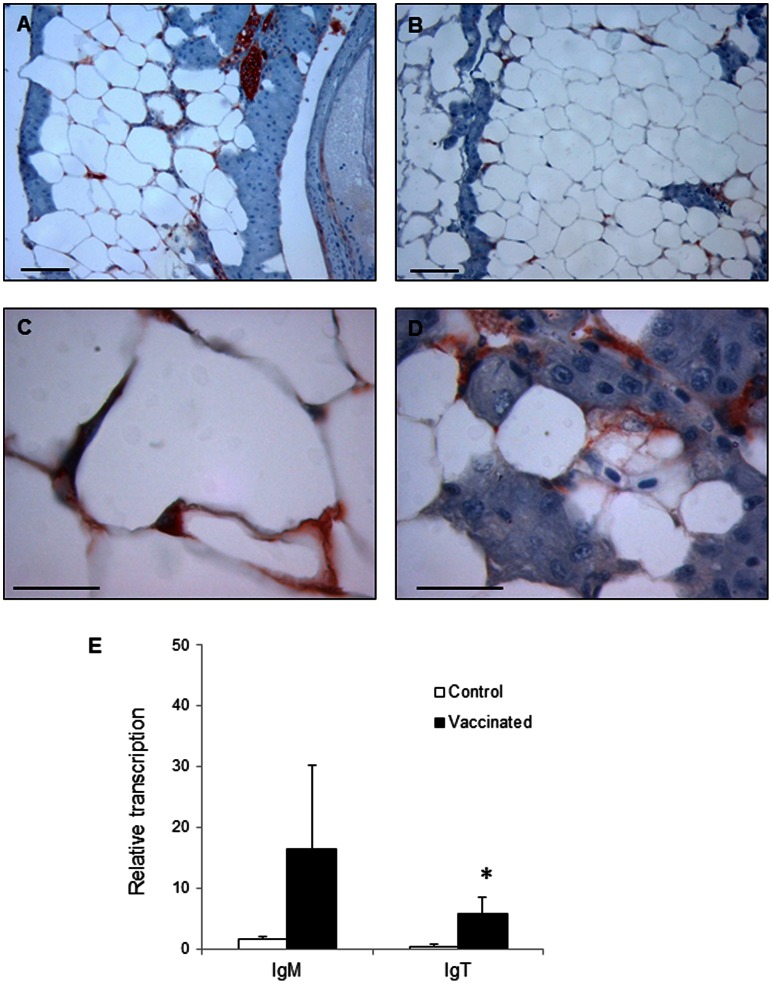
Figure 9. B cells in the adipose tissue surrounding the pyloric caeca.
Inmunohistochemical detection of trout IgM+ (A, C) and IgT+ (B, D) cells in the adipose tissue of naïve fish. Bar: 100 µm. E. Levels of transcription of IgM and IgT estimated through real time PCR in control (mock-vaccinated with empty alginate microspheres) and vaccinated fish. Trout were orally vaccinated and sampled as described in the legend of Figure 4 and data are shown as the mean relative gene expression normalized to the transcription of the house-keeping gene EF-1α ± SD. The relative significance of differences between fish vaccinated with the empty plasmid and vaccinated fish at each segment of the digestive tract was determined through a one-way ANOVA and is shown above the bars as*.

