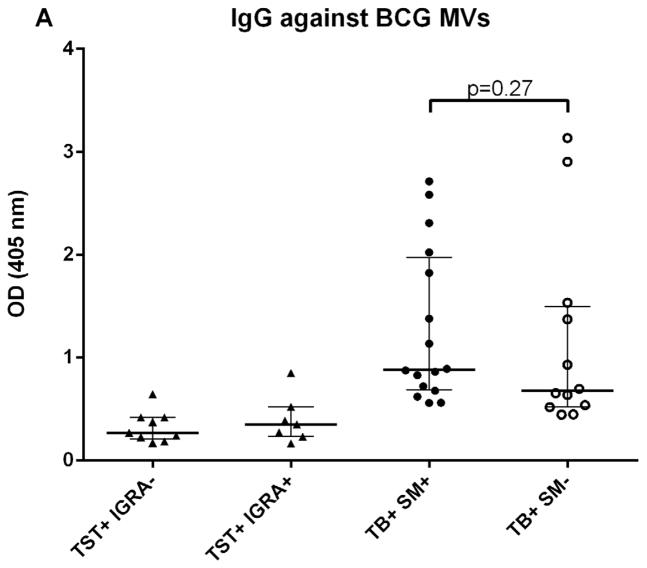
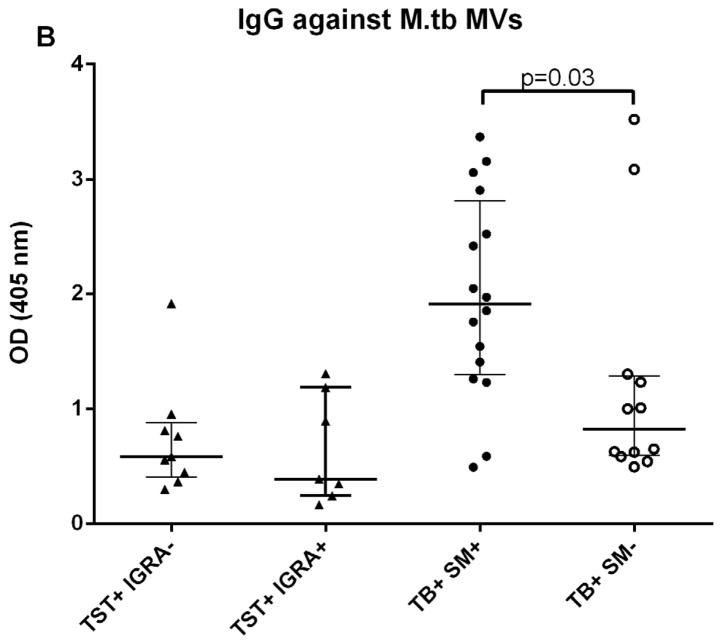
Fig. 2.
A–B. IgG responses to BCG (A) and M. tuberculosis MVs (B), demonstrating significantly higher IgG titers in smear-positive compared to smear-negative TB patients against M. tuberculosis MVs but not against BCG MVs. Statistical analysis with Mann-Whitney U test. Bars show median values with interquartile range.


