Abstract
Using discrete-time survival models of parity progression and illustrative data from the Philippines, this article develops a multivariate multidimensional life table of nuptiality and fertility, the dimensions of which are age, parity, and duration in parity. The measures calculated from this life table include total fertility rate (TRF), total marital fertility rate (TMFR), parity progression ratios (PPR), age-specific fertility rates, mean and median ages at first marriage, mean and median closed birth intervals, and mean and median ages at childbearing by child’s birth order and for all birth orders combined. These measures are referred to collectively as “TFR and its components.” Because the multidimensional life table is multivariate, all measures derived from it are also multivariate in the sense that they can be tabulated by categories or selected values of one socioeconomic variable while controlling for other socioeconomic variables. The methodology is applied to birth history data, in the form of actual birth histories from a fertility survey or reconstructed birth histories derived from a census or household survey. The methodology yields period estimates as well as cohort estimates of the aforementioned measures.
Keywords: Survival model, Life table, Nuptiality, Fertility, Total fertility rate
Introduction
This article builds on earlier work published in this journal (Retherford et al. 2010), which developed a multivariate generalization of Feeney’s method for estimating a total fertility rate (TFR) from period parity-progression ratios (PPRs). In Feeney’s method, period PPRs are calculated by a life table method that is applied to either actual birth histories from a fertility survey or reconstructed birth histories derived from a census or household survey (Feeney and Yu 1987; Luther and Cho 1988). A separate period life table of parity progression, the time dimension of which is duration in parity, is calculated for each parity transition, and a PPR is calculated from this life table. A TFR is then calculated as
| (1) |
where pB denotes the PPR for transition from woman’s own birth to first marriage (B–M), pM denotes the PPR for transition from first marriage to first birth (M−1), p1 denotes the PPR for transition from first birth to second birth (1–2), and so on.1 In this formula, first marriages are treated mathematically like births. A total marital fertility rate, TMFR (which is actually a total ever-marital fertility rate), is obtained by setting pB = 1 in Eq. (1). Feeney’s method also allows calculation of mean and median ages at first marriage and mean and median closed birth intervals by child’s birth order from the parity-specific life tables.
In the earlier work (Retherford et al. 2010), the multivariate generalization of Feeney’s method is based on discrete-time survival models of parity progression, with one such model for each parity transition. The response variable in the model for a particular parity transition, from parity i to parity i + 1, is the discrete-time hazard function Pit, denoting the conditional probability of failure (first marriage or next birth) between durations in parity t and t + 1. The main predictor variable in the model is duration in parity. Other predictor variables are socioeconomic variables of interest, such as urban/rural residence and education. The set of model-predicted probabilities Pit for particular i and specified values of the socioeconomic variables is used to calculate a life table of parity progression. From that point onward, the method proceeds as in Feeney’s original method, yielding the same set of nuptiality and fertility measures as before. The difference is that the probabilities Pit, the life tables of parity progression calculated from those probabilities, and all measures calculated from those life tables are all multivariate in the sense that they can be tabulated by categories or selected values of one socioeconomic variable while controlling for the other socioeconomic variables. Henceforth in this article, we refer to this earlier multivariate generalization of Feeney’s method as the “Pit method.”
The new method in this article extends the Pit method by adding woman’s age to the set of predictor variables in the discrete-time survival models of parity progression. The measures estimated then include not only TFR, TMFR, PPRs, mean and median ages at first marriage, and mean and median closed birth intervals, but also age-specific fertility rates (ASFRs) and mean and median ages at childbearing by child’s birth order and for all births combined. Henceforth, in the interest of brevity, we refer to these measures collectively as “TFR and its components.”
The objectives of this article are (1) to describe the basic features of the new method; (2) to demonstrate, using illustrative data from the 2003 Philippines Demographic and Health Survey (DHS), that the estimates of TFR and its components derived by the new method fit the data remarkably well; and (3) to validate the use of reconstructed birth histories (as an alternative when actual birth histories are not available) by comparing model-predicted estimates of TFR and its components based alternatively on actual birth histories and reconstructed birth histories for the same women.
The New Method
The discrete-time survival models for the separate parity transitions, with woman’s age A at starting parity added to the set of predictor variables in each model, collectively generate a set of transition probabilities PAit. Once estimated, the probabilities PAit are relabeled as probabilities Pait by replacing A with a = A + t, where a denotes woman’s age at duration in parity t. The new method then replaces the set of life tables (one life table for each parity transition) used in the Pit method with a single multidimensional life table, generated from the probabilities Pait, that incorporates all parity transitions. The dimensions of this life table are age, parity, and duration in parity. The multidimensional life table follows an initial cohort of women (real or synthetic, depending on whether the probabilities Pait are based on cohort or period data) one year at a time by age, parity, and duration in parity until the women reach age 50. Events (failures) in this life table are first marriages and births by birth order. Predicted values of TFR and its components are derived from this life table. As in the earlier Pit method, the predicted values of TFR and its components are all multivariate in the sense defined earlier.
A number of discrete-time survival models are available for modeling the various parity transitions. For reasons explained in the earlier work (Retherford et al. 2010), we use the complementary log-log (CLL) model. The base data to which a discrete-time survival model is fitted are in the form of an “expanded sample” comprising person-year observations. The model can be fitted not only to cohort data but also to period data by excluding person-year observations before and after the period of interest.
Henceforth, we refer to this improved method as the “Pait method.” More detailed explanations of the Pait method and its application to real data are included in the online supplement to this research note (Online Resource 1) and in Retherford et al. (2011).
Illustrative Application to 2003 Philippines Demographic and Health Survey Data
To test how closely the estimates of TFR and its components derived by the Pait method fit the Philippines data, we compare estimates of selected fertility measures derived by four methods: (1) the birth history method (not multivariate), (2) the Pit method, (3) the Pait method based on actual birth histories, and (4) the Pait method based on reconstructed birth histories for the same set of women. The testing pertains to estimates for the whole country, which means that socioeconomic variables are omitted from the parity-specific models, leaving only age and duration in parity (plus variables representing nonlinearities and interactions between these two variables) as predictor variables. Results are shown in Table 1 and Figs. 1–4.
Table 1.
Comparison of selected fertility measures derived by the birth history, Pit, and Pait methods: Philippines 2003 DHS, whole country
| Fertility Measure | Birth History Method | Pit Method |
Pait Method
|
|
|---|---|---|---|---|
| Actual Birth Histories | Reconstructed Birth Histories | |||
| Cohort Estimates | ||||
| TMFR | 4.70 | 4.59 | 4.63 | 4.62 |
| TFR | 4.50 | 4.38 | 4.41 | 4.40 |
| Mean Ac | 28.6 | na | 28.4 | 28.5 |
| Median Ac | 28.5 | na | 28.3 | 28.4 |
| Period Estimates | ||||
| TMFR | 3.69 | 3.65 | 3.38 | 3.47 |
| TFR | 3.48 | 3.45 | 3.18 | 3.27 |
| Mean Ac | 27.9 | na | 28.0 | 28.1 |
| Median Ac | 27.7 | na | 27.9 | 28.0 |
Notes: “Cohort” refers to the lifetime experience of women aged 45–49 at time of survey. “Period” refers to the five-year period preceding the survey. Ac denotes age at childbearing. Mean and median Ac refer to all births regardless of birth order. In the cohort case, the birth history estimates of TMFR and TFR are derived from PPRs calculated directly from numbers of first marriages and births experienced in earlier years by women aged 45–49 at time of survey, and the birth history estimates of mean and median Ac are calculated directly from the ages at childbirth associated with the births that occurred to women in the cohort. In the period case, the birth history estimates of TMFR and TFR are derived by Feeney’s PPR-based method, and the estimates of mean and median Ac are calculated from period ASFRs estimated by the conventional birth history method.
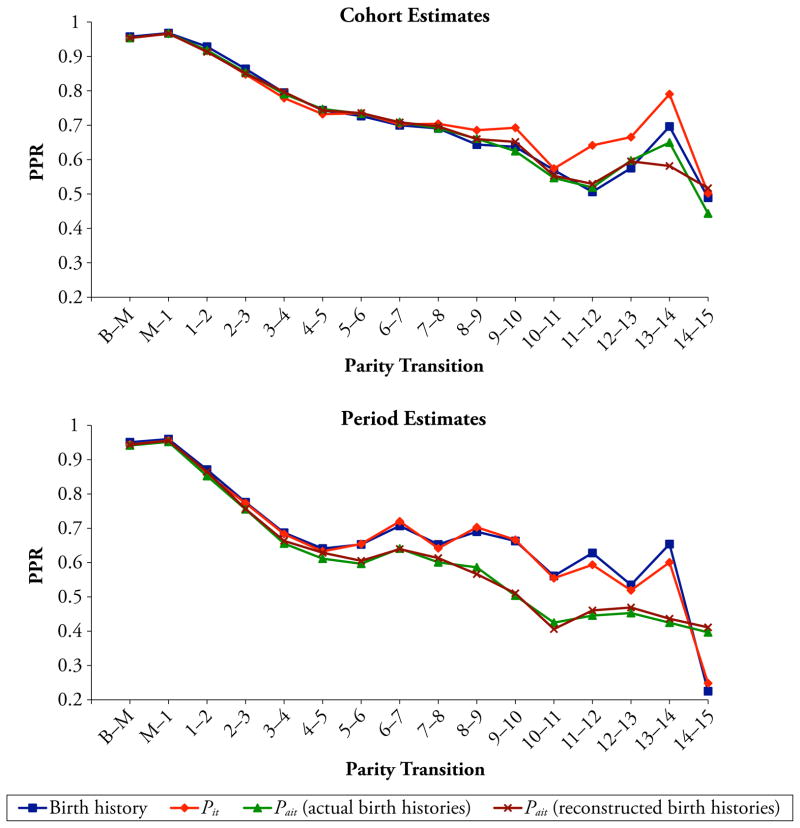
Fig. 1.
Comparison of parity progression ratios (PPRs) derived alternatively by the birth history, Pit, and Pait methods: Philippines 2003 DHS, whole country. In Figs. 1–4, in the case of cohort estimates, the open-ended parity transition is 13+ to 14+ for the Pit- and Pait-derived estimates based on actual birth histories, and 12+ to 13+ for the Pait-derived estimates based on reconstructed birth histories. In the case of period estimates, the open-ended parity transition is 13+ to 14+ for the Pit method and 11+ to 12+ for the Pait method
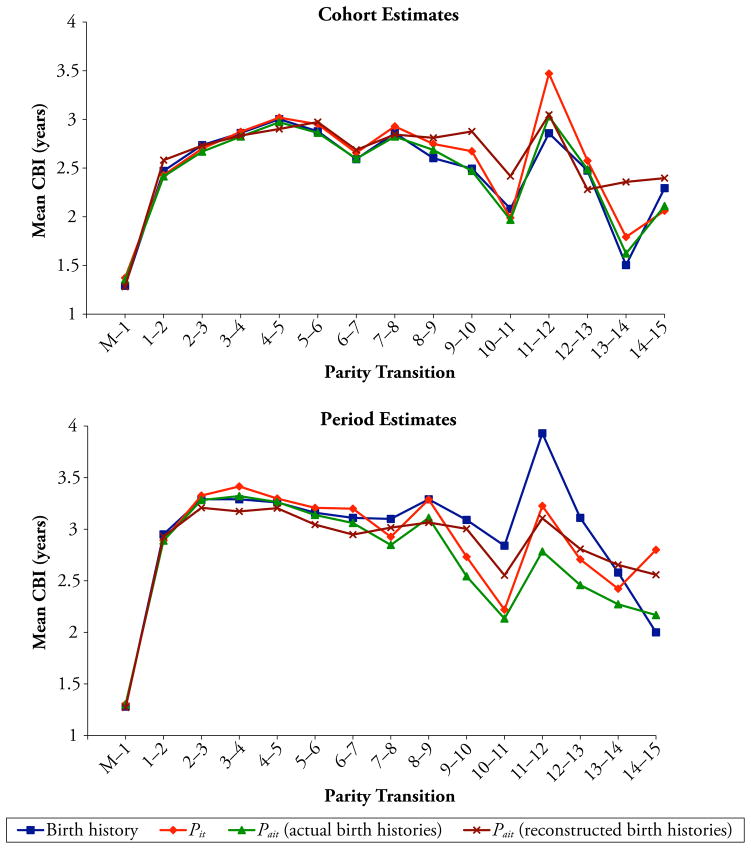
Fig. 4.
Comparison of mean closed birth intervals by child’s birth order (CBI) derived alternatively by the birth history, Pit, and Pait methods: Philippines 2003 DHS, whole country
The four methods are applied to both cohort data and period data. The cohort data pertain to actual birth histories of women aged 45–49 at time of survey. The period data pertain to person-year observations within the five-year period preceding the survey, based on women aged 10–49 at time of survey. The data are described in more detail in Online Resource 1 and in Retherford et al. (2011).
Cohort estimates are used instead of period estimates to test goodness of fit because, in the cohort case, the four methods should yield close to identical results. The cohort estimates derived by the birth history method (see the footnote to Table 1) are the gold standard for purposes of comparison. By contrast, we expect the period estimates derived by the Pait method to differ from the estimates derived by the birth history method because population composition by age, parity, and duration in parity differs between the multidimensional life table population and the actual population.
The reconstructed birth histories used in the fourth method require some additional explanation. The Philippines DHS first selected a household sample and then created an individual sample consisting of all women of reproductive age in the household sample. The survey included a household questionnaire containing limited information about the household as a whole and each of its members, and an individual questionnaire containing a great deal more information about women aged 15–49. Birth histories were collected for women in the individual sample. We created reconstructed birth histories for these same women in the household sample by treating the household sample as if it were a census sample, with information limited to age, sex, marital status, age at first marriage, relation to head of household, urban/rural residence, and education, with information on number of children ever born (parity) borrowed from the woman’s individual questionnaire. In this article, the information on residence and education is not used.
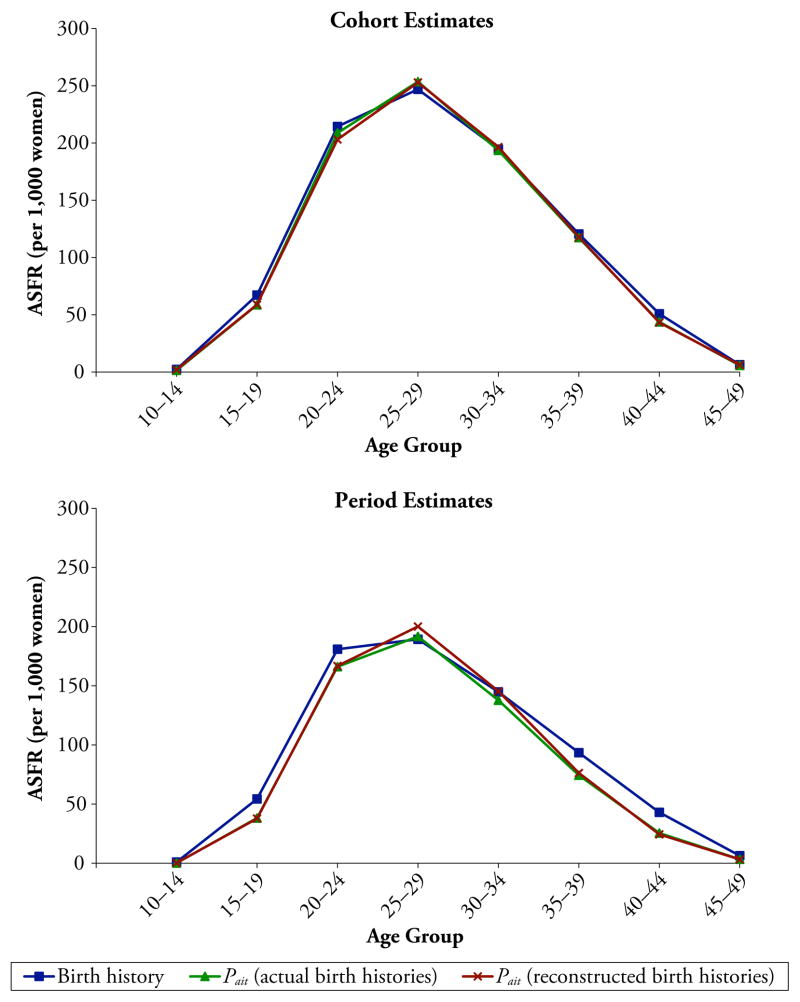
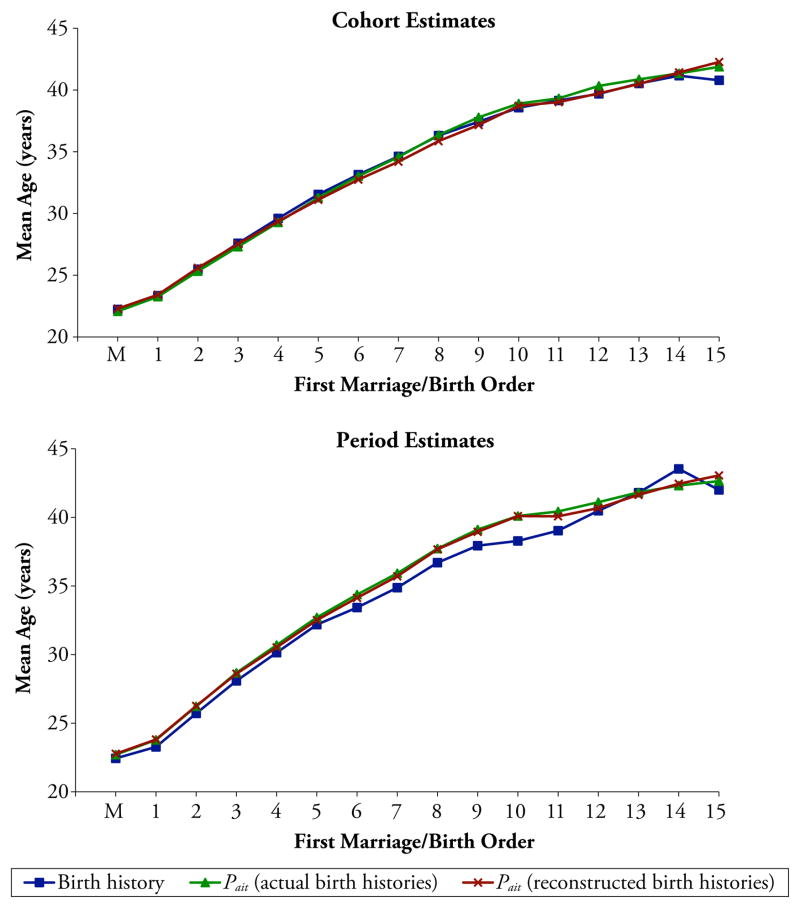
In the case of the cohort estimates in the upper halves of Table 1 and Figs. 1–4, the general picture is that the Pait-derived estimates of TFR and its components agree closely with the birth history estimates of these measures, as expected.2 As explained in the footnote to Fig. 1 and in more detail in Online Resource 1, discrepancies at the very high parities stem partly from variation in the parity that marks the start of the open-parity interval, into which later parities are grouped because of insufficient numbers of cases at single parities.
In the case of the period estimates in the lower halves of Table 1 and Figs. 1–4, by contrast, the general picture is that the Pait-derived estimates of ASFRs, PPRs, TFR, and TMFR are considerably lower than the corresponding birth history–derived fertility estimates (see the footnote to Table 1 regarding the birth history–derived estimates). Perhaps the easiest way to see why the Pait-derived period fertility estimates are relatively low is to consider the period PPRs in the lower half of Fig. 1. The period PPRs are relatively low apparently because (1) among women of any given parity and duration in parity in any given calendar year, average age tends to be older in the synthetic life table population than in the actual population, as a consequence of higher fertility in the past in the actual population; and (2) at any given parity and duration in parity, fertility tends to decline as age increases, especially at the higher parities where fertility decline in the Philippines has been concentrated.
The period analysis also shows that the birth history–derived estimates and the Pit-derived estimates of PPRs, TFR, and TMFR are close to the same. This is expected because in the case of the period estimates, the birth history estimates of PPRs, TFR, and TMFR are derived by Feeney’s method, and the Pit method reduces to Feeney’s method when socioeconomic variables are omitted from the CLL models that underlie the Pit method. The agreement between the two methods is not perfect, however, because the Pit method imposes functional forms on the data that are not imposed by Feeney’s method. By contrast, the results also show that the Pait-derived period estimates of mean and median ages at childbearing agree closely with comparable estimates derived from estimates of ASFRs derived by the conventional birth history method, indicating that the period estimates of mean age at childbearing are not very sensitive to compositional differences by age, parity, and duration in parity between the multidimensional life table population and the actual population. The results also show that the Pait-derived period estimates of the four fertility measures derived from reconstructed birth histories agree closely with corresponding Pait-derived period estimates derived from actual birth histories. (See Online Resource 1 for a more detailed discussion of the results in Table 1 and Figs. 1–4.)
Socioeconomic variables are handled in the Pait method in the same way as in the Pit method in Retherford et al. 2010. (See Online Resource 1 for a Pait-based illustrative analysis of the effects of socioeconomic variables on TFR and its components, again using data from the 2003 Philippines DHS.)
Concluding Remarks
Although the focus of this article has been on developing and testing methodology, a noteworthy finding from the illustrative application to Philippines DHS data is that when socioeconomic variables are omitted from the underlying CLL models, so that variables based on age and duration in parity are the only predictors remaining in the model for each parity transition, the Pait-derived estimate of the period TFR (3.18, based on actual birth histories) is 0.39 birth lower than the conventional birth history estimate of the period TFR calculated from ASFRs (3.57; not shown in Table 1). This large discrepancy appears to stem mainly from the previously mentioned compositional differences between the synthetic multidimensional life table population and the actual population. The composition of the actual population by age, parity, and duration in parity is affected by past trends in fertility, mortality, and migration. By contrast, the composition of the multidimensional life table population depends only on current values of the probabilities Pait. Viewed from this perspective, the Pait-derived period TFR provides a more accurate indication of future mean number of births per woman in the population than does the conventional ASFR-based period TFR.
Supplementary Material
Fig. 2.
Comparison of age-specific fertility rates (ASFRs) derived alternatively by the birth history and Pait methods: Philippines 2003 DHS, whole country
Fig. 3.
Comparison of mean age at first marriage and mean ages at childbirth by child’s birth order derived alternatively by the birth history and Pait methods: Philippines 2003 DHS, whole country
Acknowledgments
Support for this research was provided by Grant 1R01HD057038 from the U.S. National Institutes of Health and by a grant obtained by the Nihon University Population Research Institute from the Academic Frontier Project for Private Universities: matching fund subsidy from MEXT (Japan Ministry of Education, Culture, Sports, Science and Technology), 2006–2010.
Footnotes
Alternatively, a single 0–1 transition can be used in place of the B–M and M–1 transitions.
Medians show patterns similar to those shown for means.
Contributor Information
Robert D. Retherford, Email: retherfr@eastwestcenter.org, East-West Center, 1601 East-West Road, Honolulu, HI 96848
Hassan Eini-Zinab, East-West Center, Honolulu, Hawaii USA.
Minja Kim Choe, East-West Center, Honolulu, Hawaii USA.
Naohiro Ogawa, Nihon University, Tokyo, Japan.
Rikiya Matsukura, Nihon University, Tokyo, Japan.
References
- Feeney G, Yu J. Period parity progression measures of fertility in China. Population Studies. 1987;41:77–102. doi: 10.1080/0032472031000142546. [DOI] [PubMed] [Google Scholar]
- Luther NY, Cho LJ. Reconstruction of birth histories from census and household survey data. Population Studies. 1988;42:451–472. [Google Scholar]
- Retherford RD, Eini-Zinab H, Choe MK, Ogawa N, Matsukura R. East-West Center Working Paper. Vol. 122. Honolulu, HI: East-West Center; 2011. Further development of methodology for multivariate analysis of the total fertility rate and its components based on birth-history data. Retrieved from http://www.eastwestcenter.org/fileadmin/stored/pdfs/popwp122.pdf. [Google Scholar]
- Retherford RD, Ogawa N, Matsukura R, Eini-Zinab H. Multivariate analysis of parity progression-based measures of the total fertility rate and its components. Demography. 2010;47:97–124. doi: 10.1353/dem.0.0087. [DOI] [PMC free article] [PubMed] [Google Scholar]
Associated Data
This section collects any data citations, data availability statements, or supplementary materials included in this article.


