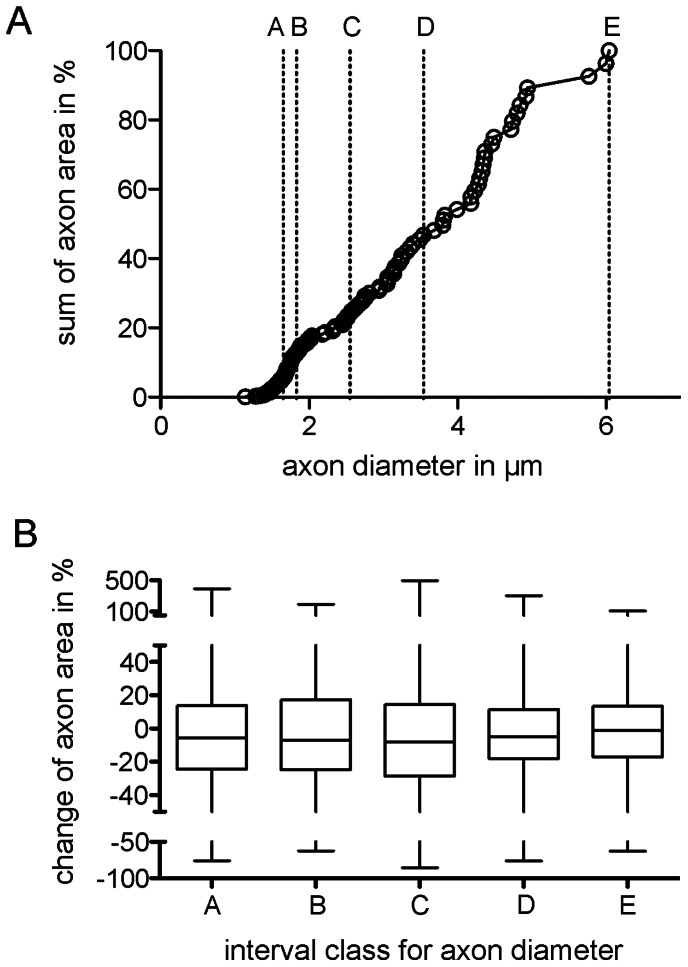
Figure 5. Comparison of the classes.
A: Distribution of the idealized diameters of axons with respect to the sum of all measured inner cross-sectional axonal areas in %. The classes A to E contain 24 axons each, within the following diameter intervals: (A) 1.14 µm to 1.65 µm, B) 1.66 µm to 1.83 µm, C) 1.84 µm to 2.55 µm, D) 2.56 µm to 3.54 µm, E) 3.55 to 6.04 µm. B: Median and quartiles for each group were calculated on the basis of the individual derivations from the mean area within the individual axons. The narrowest quartiles were observed in the largest axon classes. In the pooled approach, the five classes were significantly different from each other (Kruskal-Wallis test, p = 0.0006). Note that while all classes are significantly different, the larger axons have diameter variation through the tracing of 32 slices.

