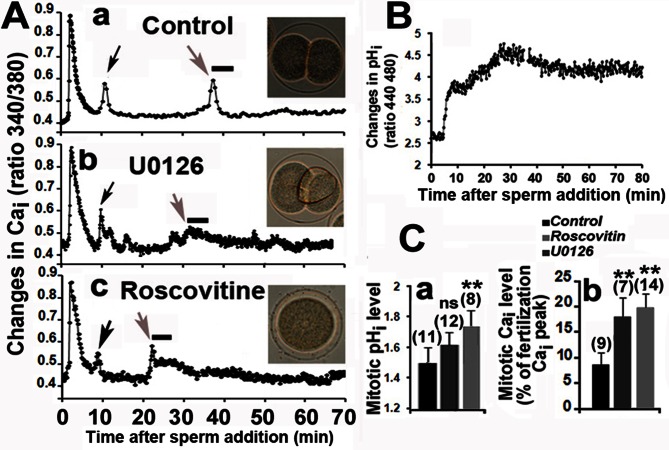
Figure 1. ERK and CDK activities control Cai and pHi after fertilization.
A. Time courses of Cai changes after fertilization in eggs treated or not (a) 10 mins after sperm addition (time zero) with 2 µM U0126 (b) or 20 µM Roscovitine (c). One typical recording is shown for each condition. Cai transients occur at time of pronuclear migration (black arrows) and at mitosis (grey arrow). Inset images taken 80 mins after fertilization show normal division in control eggs (a), mitotic alterations with U0126 (b) and absence of mitosis with Roscovitine (c). B. Time course of pHi changes after fertilization of control eggs. C. Relative changes in pHi (a) and Cai (b) levels in eggs treated or not (control) with 2 µM U0126 or 20 µM Roscovitine. The mean levels of pHi recorded from 60 and 65 mins following sperm addition are expressed relative to that of unfertilized egg (arbitrarily taken as 1). Mean levels of Cai recorded during 5 mins at time of the mitotic peak (grey arrow and line in Fig. A), i.e. between 35–40 mins in control eggs, 30–35 mins in U0126 and 25–30 mins in Roscovitine treated eggs, are expressed as the percentage of the fertilization Cai peak arbitrarily taken as 100. The total number of eggs monitored is indicated for each condition (brackets). Values (mean +/− sem) are significantly higher than that of control eggs (**, student test, p<0.01) or not significantly different (ns).

