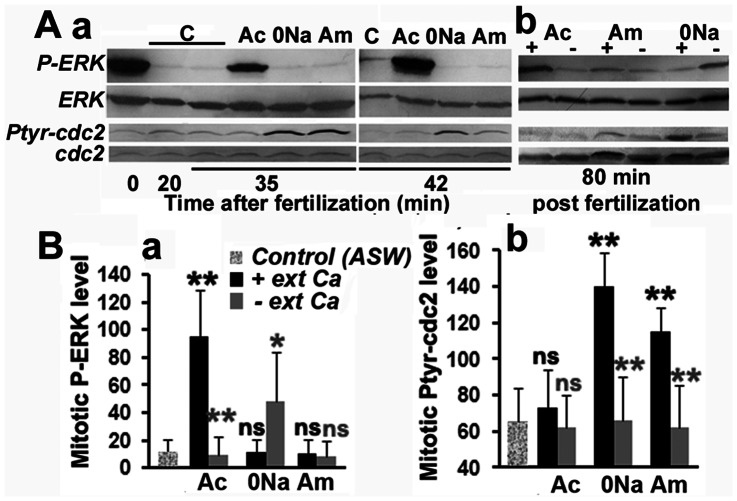
Figure 3. Cai and pHi define P-ERK and Ptyr-cdc2 levels at mitosis.
A. Changes in Ptyr-cdc2 and P-ERK levels induced in fertilized eggs transferred or not (control, C) 20 mins after fertilization in Ac, 0Na or Am in the presence (+) or not (–) of external Ca. Total ERK and cdc2 do not vary during the experiment. B: Compiled assessment of P-ERK (a) and Ptyr-cdc2 (b) signals obtained at time of mitosis as visualized in A, and from three experiments that gave similar results. Values (means +/− sem) are significantly different (student test, p<0.01, two black stars or p<0.05, one black star) or not (ns, black letters) from control. Comparison between those obtained in the absence or presence of external Ca is also given (grey stars and letters).

