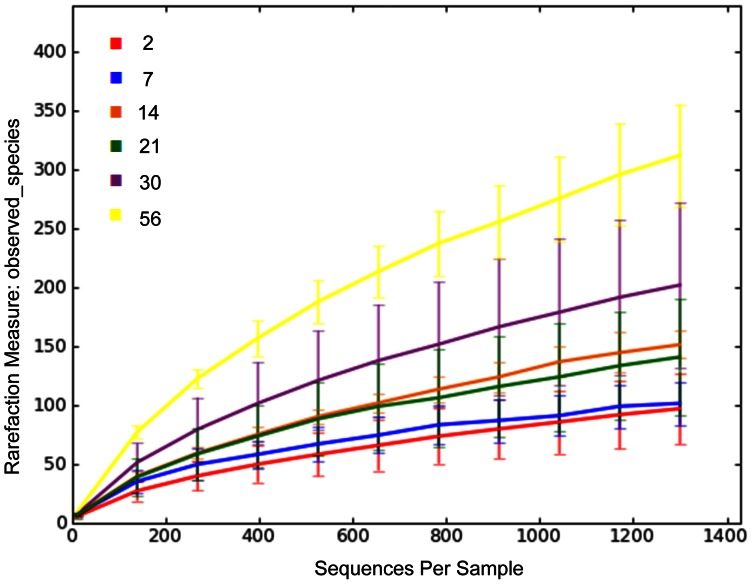
Figure 2. Rarefaction analysis of 16 S rRNA gene sequences obtained from fecal swabs from foals.
Lines represent the average numbers obtained at each age (legend numbers refer to the age in days), while the error bars represent the standard deviations. The analysis was performed on a randomly selected subset of 1,300 sequences per sample and included samples from 42 foals. Note the progressive increase in observed species (representing microbial diversity) with sequential age. The numbers for the legend represent age (in days).

