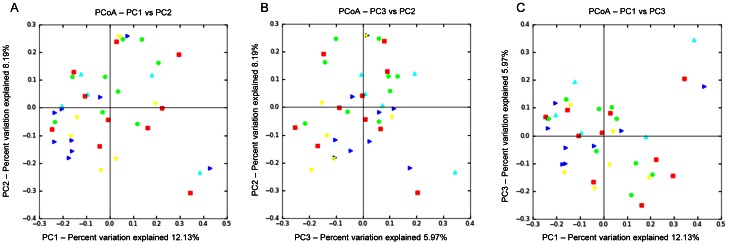
Figure 4. Principal coordinates analysis (PCoA) of unweighted UniFrac distances of 16 S rRNA genes.
Analysis for 42 foals in groups control with CTB (red square), control without CTB (yellow triangle), low-dose inactivated R. equi (dark blue triangle), high-dose inactivated R. equi 2 (green dot), and live R. equi (light blue triangle) at 30 days of age only. Differences among groups were not significant (ANOSIM, P = 0.449). The 3 panels represent the comparison of the first 2 principal components (A), the second and third principal components (B), and the first and third principal components (C).

