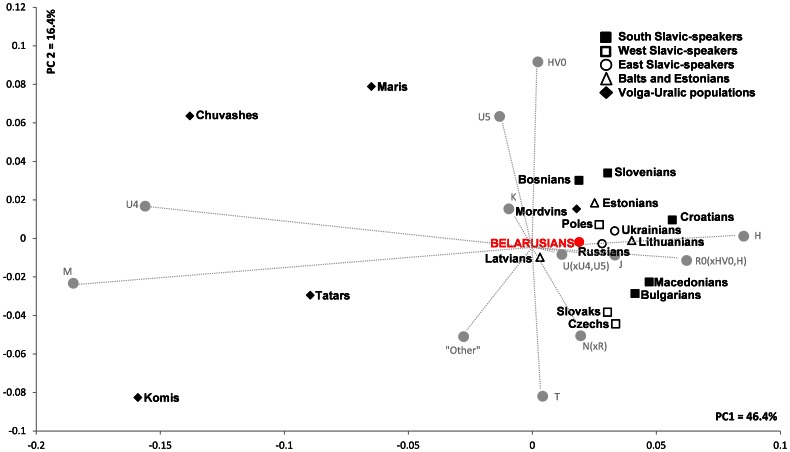
Figure 3. PC analysis based on mtDNA haplogroup frequencies among eastern Europeans and Balkan populations.
The contribution of each haplogroup to the first and the second PCs is shown in gray. The group “Other” includes “Other” from published data merged with uncommon haplogroups L1b, L2a and L3f. Frequencies of mtDNA haplogroups and references are listed in Table S3.

