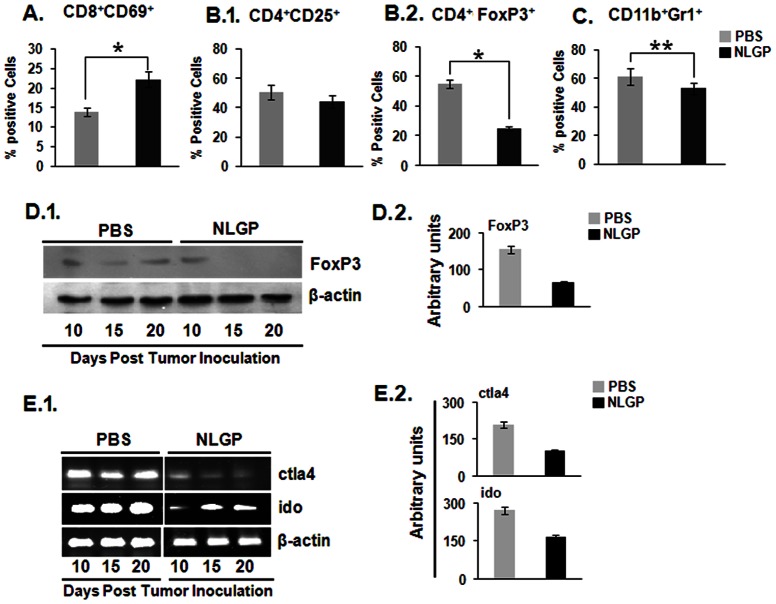
Figure 3. NLGP downregulates suppressor cells within TME.
Single cell suspension was prepared from day 20 tumors of PBS and NLGP treated mice. A. Proportion of activated T cells B.1. CD4+CD25+ cells, B.2. Tregs, C. and MDSCs within tumors from these two groups of mice was determined flow cytometrically after labeling cells with fluorescence tagged CD8, CD69, CD4, CD25 and CD11b, GR1 antibodies. *p<0.001, **p<0.05. D.1. Total protein was isolated from tumors at different days and level of Foxp3 was analyzed by immunoblot analysis. D.2. Densitometric analysis was performed in each case. E.1. Total RNA was also purified to assess the expression status of CTLA4 and IDO on different time points of tumor growth. E.2. Densitometric analysis was performed in each case.

