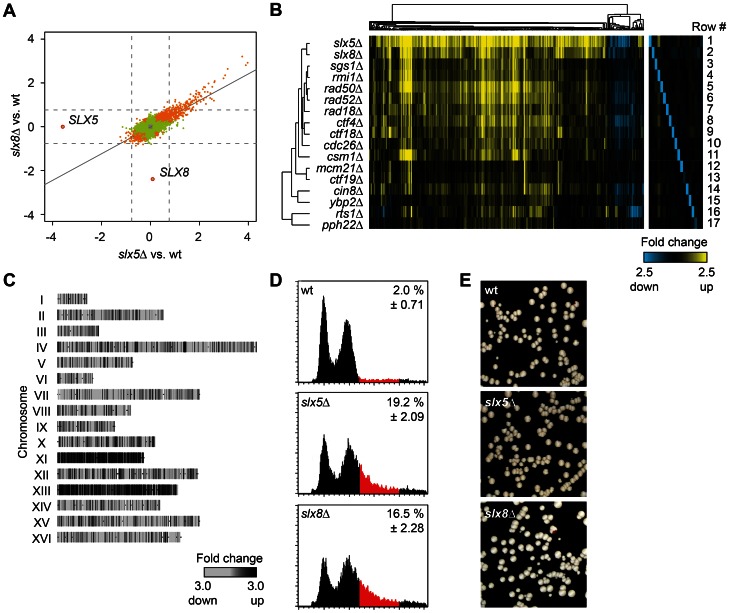
Figure 1. Slx5Δ and slx8Δ display a genome instability-induced stress response.
(A) Scatter plot comparing the changes in mRNA expression levels in slx5Δ and slx8Δ mutants. Fold change (FC) in expression is the average of four measurements for each mutant (two independent cultures each measured twice), plotted as log2 values of mutant over wt. Genes changing significantly (p<0.05) are indicated in orange (significant in both mutants) or green (significant in one mutant). Deleted genes are indicated. Solid line indicates the regression line. Dashed lines mark a 1.7 FC threshold. (B) Heatmap and cluster diagram of the gene expression profiles of deletion mutants, showing all significant genes (FC >1.7, p<0.05) that change at least once in any mutant. FC expression of mutant over wt is indicated by the colour scale, with yellow for upregulation, blue for downregulation and black for no change. Deleted genes are depicted in the right-hand panel. (C) Microarray expression profile of an aneuploid slx8Δ mutant with duplications of chromosome XI and XIII. Genes are mapped per chromosome. The grey scale indicates FC expression in the slx8Δ strain versus wt. (D) Flow cytometric profiles of asynchronous populations of wt, slx5Δ and slx8Δ. Cell population with a >2N DNA content, indicated in red, is quantified (± s.d., n = 3). (E) Chromosome loss assay of wt, slx5Δ and slx8Δ cells. Red-sectoring of colonies reflects loss of the reporter chromosome. Frequency of chromosome missegration events is 0.03% (n = 1 out of 3415 colonies) for wt, 0.06% (n = 2 out of 3254, p = 0.247) for slx5Δ, and 0.11% (n = 4 out of 3555, p = 0.022) for slx8Δ. Frequencies are quantified by colony half-sector analysis and significance of the difference of mutant compared to wt was determined using the binomial test.

