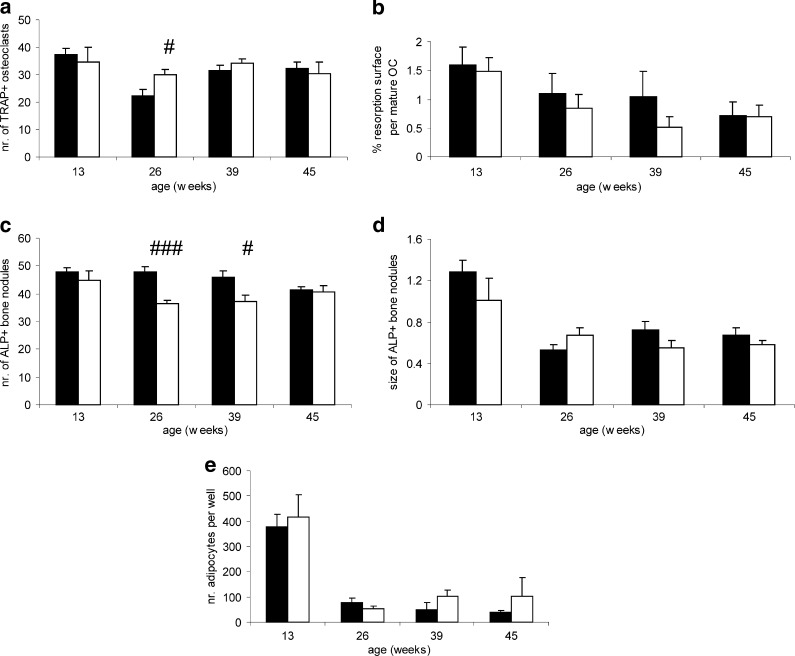
Fig. 5.
Stem cell cultures of wild-type and TTD mice. Analyses of osteoclast, osteoblast and adipocyte differentiation capacity in bone marrow cell cultures in wild-type (solid bars) and TTD mice (open bars). Number of TRAP-positive osteoclasts (a), resorption surface per mature osteoclast (b), number of alkaline phosphatase-positive bone nodules (c), size of alkaline phosphatase-positive bone nodules (d) and number of adipocytes (e). TTD mice compared to wild-type animals: # p < 0.05, ### p < 0.001; error bars represent SEM

