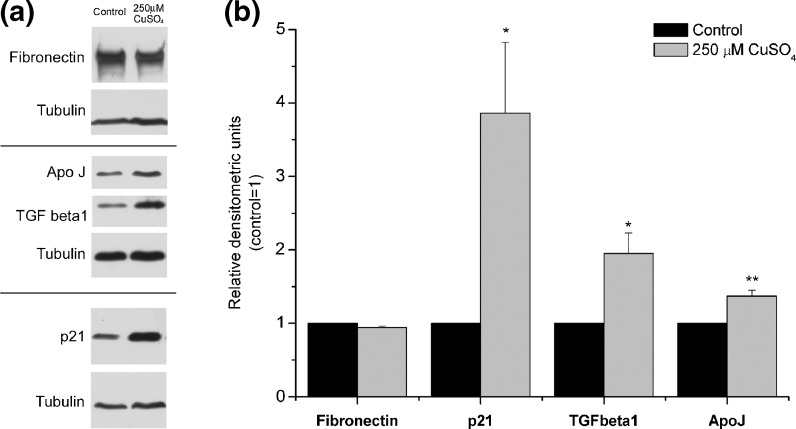
Fig. 5.
Western blot analysis of fibronectin, p21, ApoJ, and TGF β1 protein levels. a Representative blots for the detection of the different proteins. Tubulin was used as loading control. b The resulting bands were quantified using densitometric analysis of the different signals. Fibronectin intracellular content remained unaltered after exposure to 250 μM CuSO4, comparing with controls. Protein levels of p21, TGF β1, and Apo J were 3.9-, 2-, and 1.4-fold increased, after exposure to 250 μM CuSO4, respectively, when compared with control levels. Data are expressed as mean ± SEM from at least three independent experiments. *p < 0.05; **p < 0.01 when compared with control

