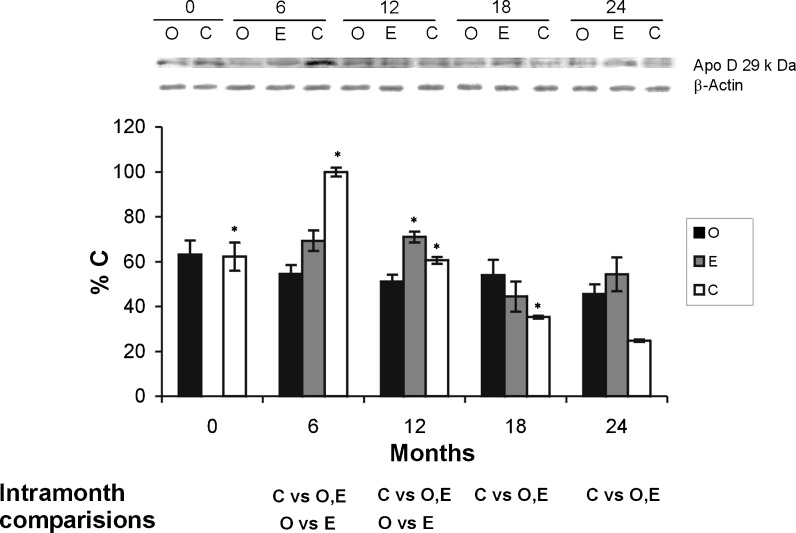
Fig. 3.
Apo D total protein content in diencephalon of ovariectomized animals (O; black bars), sham surgery animals (intact) (C; white bars) and ovariectomized animals treated with estradiol (E; grey bars). The histogram shows the densitometric analysis of the Western blots. Values are means ± SEM (n = 7) and represented as the percentage of control values (rats of 0 month from group C). Only significant differences are shown. *p ≤ 0.05 (month vs. next month)

