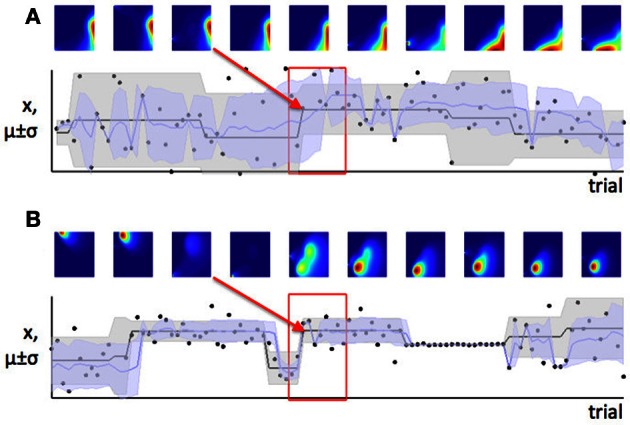
Figure 6.

Learning is faster when expected uncertainty is low. Panels (A) and (B) show two sets of trials which include changes of similar magnitude in the mean of the generative distribution (distribution from which data were in fact drawn). In panel (A), the estimate of σi is high (high expected uncertainty) but in panel (B), the estimate of σi is lower—this is indicated by the distribution of probability density from left to right in the colored parameter-space maps, and also the width of the shaded area μ ± σ on the lower plot. The red boxes indicate the set of trials shown in the parameter space maps; the red arrow shows which parameter space map corresponds to the first trial after the change point. Note that the distribution of probability in parameter space changes more slowly when expected uncertainty is high (panel A), indicating that learning is slower in this case.
