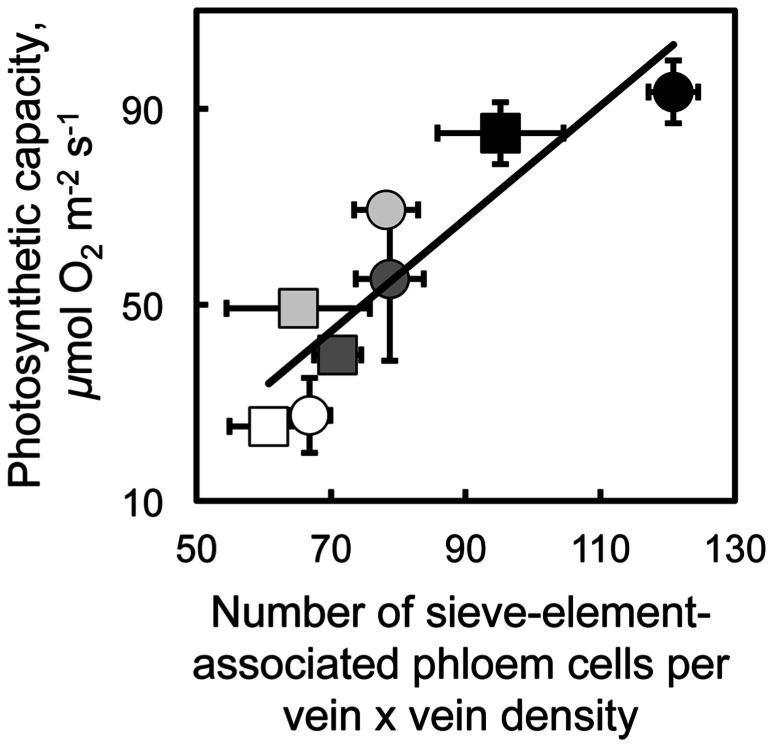
FIGURE 3.
Relationship between the light- and CO2-saturated rate of oxygen evolution (photosynthetic capacity) and the product of vein density times the number of companion and phloem parenchyma cells adjacent to sieve elements in the minor loading veins from fully expanded leaves of the apoplastic loaders Arabidopsis thaliana Col-0 (squares) and spinach (circles).Plants were grown under the following light and temperature regimes: 9-h photoperiod of 400 μmol photons m-2 s-1 under a day/night leaf temperature of 25°C/20°C (open symbols) or 14°C/8°C (light gray symbols), or 9-h photoperiod of 1000 μmol photons m-2 s-1 under a day/night leaf temperature of 25°C/20°C (dark gray symbols) or 14°C/8°C (black symbols). Mean values ± standard deviation, n = 3 to 4 leaves (one from each of three or four plants). The line is described by y = 1.15x - 36, R2 = 0.81, and p < 0.003.

