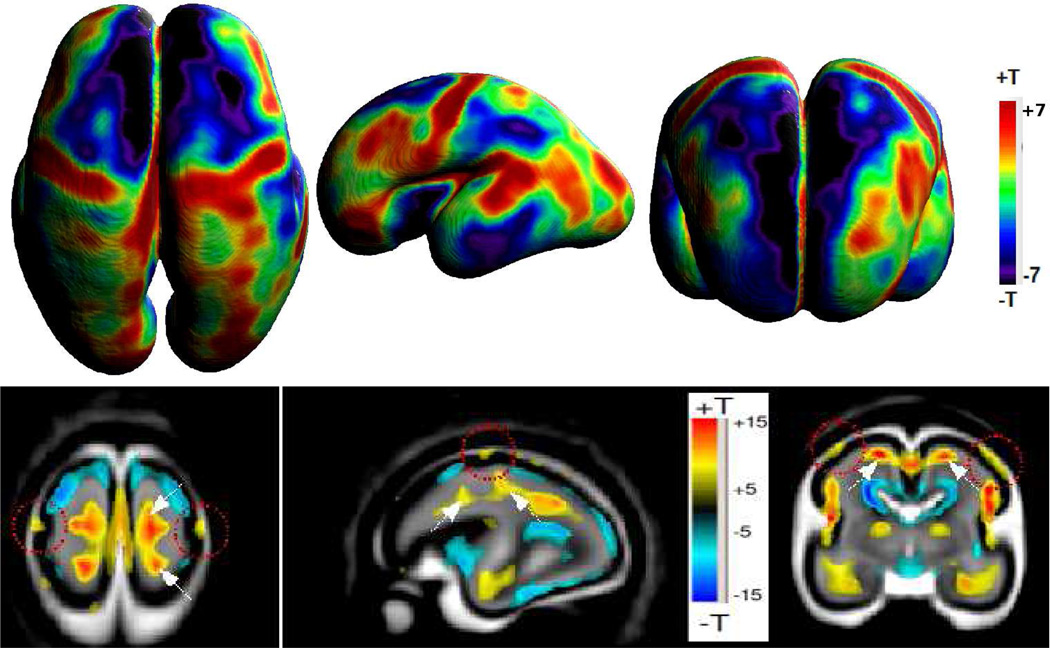
Figure 6.
Example Tensor Based Morphometry of the pattern of tissue growth between 20 and 28 gestational weeks: Statistical significance maps show points where the rate of volume increase is greater or lesser than the rate of growth of the brain as a whole. The lower row shows slices within the brain volume, while the top row shows differences across the cortical plate only. These local variations in tissue growth rate create structural complexity as the primary sulci form.

