
Figure 4.
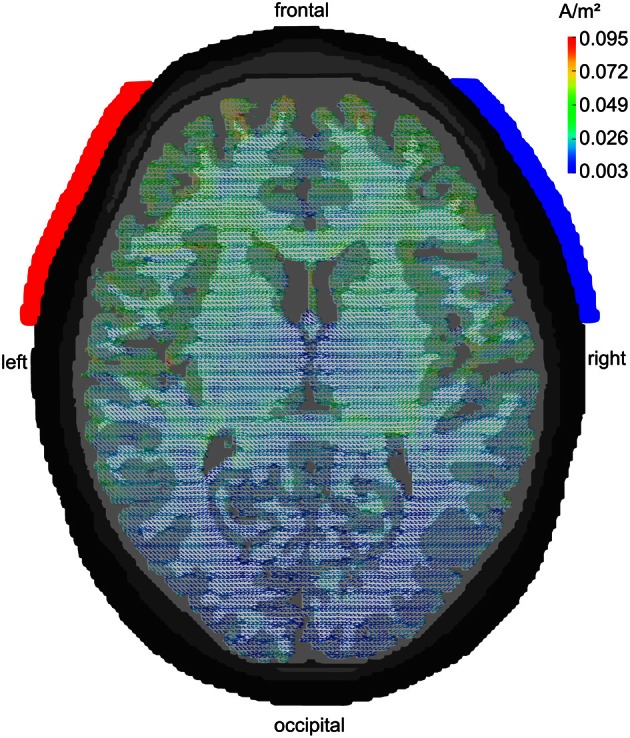
Modeling tACS-induced intracranial current flow. Axial view of a human brain visualizing the current density distribution of tDCS/tACS applied at electrode locations F7 (anode, red) and F8 (cathode, blue). A clear maximum in anterior brain areas can be seen. Current densities are 20 times stronger in frontal as compared to occipital cortex. However, tDCS/tACS with large electrodes is not as focal as TMS. Reprinted from Neuling et al. (2012b) with permission of the authors.