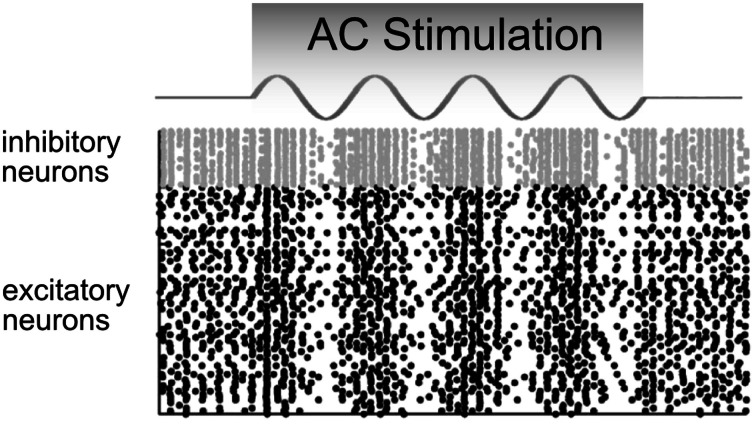
Figure 5.
Model predictions of how a network of neurons would behave in response to AC stimulation. The firing rates of inhibitory (gray) and excitatory (black) neurons are up- and down-regulated in phase with the AC current. In these raster plots, each dot represents a neural spike. Adapted from Reato et al. (2010).

